CUBE SUGAR CONTAINER

技術系のこと書きます。

Python: Keras で AutoEncoder を書いてみる

今回はニューラルネットワークのフレームワークの Keras を使って AutoEncoder を書いてみる。 AutoEncoder は入力になるべく近い出力をするように学習したネットワークをいう。 AutoEncoder は特徴量の次元圧縮や異常検知など、幅広い用途に用いられている。

使った環境は次の通り。

$ sw_vers        
ProductName:    Mac OS X
ProductVersion: 10.14.6
BuildVersion:   18G95
$ python -V 
Python 3.7.4

下準備

まずは必要なパッケージをインストールしておく。

$ pip install keras tensorflow matplotlib

中間層が一層の AutoEncoder

Keras の Sequential API を使って実装した最も単純な AutoEncoder のサンプルコードを以下に示す。 データセットには MNIST を使った。 入力と出力が 28 x 28 = 784 次元なのに対し、中間層は一層で 36 次元しかない。 つまり、中間層では次元圧縮に相当する処理をしている。

#!/usr/bin/env python
# -*- coding: utf-8 -*-

import numpy as np
from keras import layers
from keras import models
from keras import callbacks
from keras.datasets import mnist
from matplotlib import pyplot as plt
from matplotlib import cm

def main():
    # MNIST データセットを読み込む
    (x_train, train), (x_test, y_test) = mnist.load_data()
    image_height, image_width = 28, 28
    # 中間層で圧縮される次元数
    encoding_dim = 36  # 中間層の出力を 6 x 6 の画像として可視化するため

    # Flatten
    x_train = x_train.reshape(x_train.shape[0], image_height * image_width)
    x_test = x_test.reshape(x_test.shape[0], image_height * image_width)

    # Min-Max Normalization
    x_train = x_train.astype('float32')
    x_test = x_test.astype('float32')
    x_train = (x_train - x_train.min()) / (x_train.max() - x_train.min())
    x_test = (x_test - x_test.min()) / (x_test.max() - x_test.min())

    # 中間層が一層だけの単純な AutoEncoder
    model = models.Sequential()
    model.add(layers.Dense(encoding_dim, activation='relu',
                           input_shape=(image_height * image_width,)))
    model.add(layers.Dense(image_height * image_width,
                           activation='sigmoid'))

    # モデルの構造を確認する
    print(model.summary())

    model.compile(optimizer='adam',
                  loss='binary_crossentropy')

    fit_callbacs = [
        callbacks.EarlyStopping(monitor='val_loss',
                                patience=5,
                                mode='min')
    ]

    # モデルを学習させる
    model.fit(x_train, x_train,
              epochs=100,
              batch_size=256,
              shuffle=True,
              validation_data=(x_test, x_test),
              callbacks=fit_callbacs,
              )

    # テストデータの損失を確認しておく
    score = model.evaluate(x_test, x_test, verbose=0)
    print('test xentropy:', score)

    # 学習済みのモデルを元に、次元圧縮だけするモデルを用意する
    encoder = models.clone_model(model)
    encoder.compile(optimizer='adam',
                    loss='binary_crossentropy')
    encoder.set_weights(model.get_weights())
    # 最終段のレイヤーを取り除く
    encoder.pop()

    # テストデータからランダムに 10 点を選び出す
    p = np.random.random_integers(0, len(x_test), 10)
    x_test_sampled = x_test[p]
    # 選びだしたサンプルを AutoEncoder にかける
    x_test_sampled_pred = model.predict_proba(x_test_sampled,
                                              verbose=0)
    # 次元圧縮だけする場合
    x_test_sampled_enc = encoder.predict_proba(x_test_sampled,
                                               verbose=0)

    # 処理結果を可視化する
    fig, axes = plt.subplots(3, 10)
    for i, label in enumerate(y_test[p]):
        # 元画像を上段に表示する
        img = x_test_sampled[i].reshape(image_height, image_width)
        axes[0][i].imshow(img, cmap=cm.gray_r)
        axes[0][i].axis('off')
        axes[0][i].set_title(label, color='red')
        # AutoEncoder で次元圧縮した画像を下段に表示する
        enc_img = x_test_sampled_enc[i].reshape(6, 6)
        axes[1][i].imshow(enc_img, cmap=cm.gray_r)
        axes[1][i].axis('off')
        # AutoEncoder で復元した画像を下段に表示する
        pred_img = x_test_sampled_pred[i].reshape(image_height, image_width)
        axes[2][i].imshow(pred_img, cmap=cm.gray_r)
        axes[2][i].axis('off')

    plt.show()


if __name__ == '__main__':
    main()

上記を実行してみよう。 検証用データに対する損失は約 0.087 だった。

$ python ae.py
...(snip)...
Model: "sequential_1"
_________________________________________________________________
Layer (type)                 Output Shape              Param #
=================================================================
dense_1 (Dense)              (None, 36)                28260
_________________________________________________________________
dense_2 (Dense)              (None, 784)               29008
=================================================================
Total params: 57,268
Trainable params: 57,268
Non-trainable params: 0
_________________________________________________________________
...(snip)...
test xentropy: 0.08722344622612

同時に、以下のグラフが得られる。 上段が入力画像、中段が AutoEncoder の中間層の出力、下段が復元された出力画像になっている。

f:id:momijiame:20190908213044p:plain

上記を見ると多少ボケたりかすれたりはしているものの、ちゃんと入力に近い画像が出力されていることがわかる。 中間層の出力は人間にはよくわからないけど、これでちゃんと元の画像に近いものが復元できるのはなんとも不思議な感じ。

中間層が 5 層の AutoEncoder

試しに先ほどのネットワークに中間層を足して、キャパシティを上げてみよう。 以下のサンプルコードでは次元を 784 -> 128 -> 64 -> 36 -> 64 -> 128 -> 784 と変化させている。

#!/usr/bin/env python
# -*- coding: utf-8 -*-

import numpy as np
from keras import layers
from keras import models
from keras import callbacks
from keras.datasets import mnist
from matplotlib import pyplot as plt
from matplotlib import cm

def main():
    # MNIST データセットを読み込む
    (x_train, train), (x_test, y_test) = mnist.load_data()
    image_height, image_width = 28, 28
    # 中間層で圧縮される次元数
    encoding_dim = 36  # 6 x 6 の画像として可視化してみるため

    # Flatten
    x_train = x_train.reshape(x_train.shape[0], image_height * image_width)
    x_test = x_test.reshape(x_test.shape[0], image_height * image_width)

    # Min-Max Normalization
    x_train = x_train.astype('float32')
    x_test = x_test.astype('float32')
    x_train = (x_train - x_train.min()) / (x_train.max() - x_train.min())
    x_test = (x_test - x_test.min()) / (x_test.max() - x_test.min())

    # 中間層を 4 層まで増やしたネットワーク
    model = models.Sequential()
    model.add(layers.Dense(128, activation='relu',
                           input_shape=(image_height * image_width,)))
    model.add(layers.Dense(64, activation='relu'))
    model.add(layers.Dense(encoding_dim, activation='relu'))
    model.add(layers.Dense(64, activation='relu'))
    model.add(layers.Dense(128, activation='relu'))
    model.add(layers.Dense(image_height * image_width,
                           activation='sigmoid'))

    # モデルの構造を確認する
    print(model.summary())

    model.compile(optimizer='adam',
                  loss='binary_crossentropy')

    print(model.summary())

    fit_callbacs = [
        callbacks.EarlyStopping(monitor='val_loss',
                                patience=5,
                                mode='min')
    ]

    # モデルを学習させる
    model.fit(x_train, x_train,
              epochs=100,
              batch_size=256,
              shuffle=True,
              validation_data=(x_test, x_test),
              callbacks=fit_callbacs,
              )

    # テストデータの損失を確認しておく
    score = model.evaluate(x_test, x_test, verbose=0)
    print('test xentropy:', score)

    # 学習済みのモデルを元に、次元圧縮だけするモデルを用意する
    encoder = models.clone_model(model)
    encoder.compile(optimizer='adam',
                    loss='binary_crossentropy')
    encoder.set_weights(model.get_weights())
    # 中間層までのレイヤーを取り除く
    encoder.pop()
    encoder.pop()
    encoder.pop()

    # テストデータからランダムに 10 点を選び出す
    p = np.random.random_integers(0, len(x_test), 10)
    x_test_sampled = x_test[p]
    # 選びだしたサンプルを AutoEncoder にかける
    x_test_sampled_pred = model.predict_proba(x_test_sampled,
                                              verbose=0)
    # 次元圧縮だけする場合
    x_test_sampled_enc = encoder.predict_proba(x_test_sampled,
                                               verbose=0)

    # 処理結果を可視化する
    fig, axes = plt.subplots(3, 10)
    for i, label in enumerate(y_test[p]):
        # 元画像を上段に表示する
        img = x_test_sampled[i].reshape(image_height, image_width)
        axes[0][i].imshow(img, cmap=cm.gray_r)
        axes[0][i].axis('off')
        axes[0][i].set_title(label, color='red')
        # AutoEncoder で次元圧縮した画像を中段に表示する
        enc_img = x_test_sampled_enc[i].reshape(6, 6)
        axes[1][i].imshow(enc_img, cmap=cm.gray_r)
        axes[1][i].axis('off')
        # AutoEncoder で復元した画像を下段に表示する
        pred_img = x_test_sampled_pred[i].reshape(image_height, image_width)
        axes[2][i].imshow(pred_img, cmap=cm.gray_r)
        axes[2][i].axis('off')

    plt.show()


if __name__ == '__main__':
    main()

上記を実行してみる。 テストデータの損失は先ほどより減って約 0.079 となった。

$ python ae.py
...(snip)...
Layer (type)                 Output Shape              Param #   
=================================================================
dense_1 (Dense)              (None, 128)               100480    
_________________________________________________________________
dense_2 (Dense)              (None, 64)                8256      
_________________________________________________________________
dense_3 (Dense)              (None, 36)                2340      
_________________________________________________________________
dense_4 (Dense)              (None, 64)                2368      
_________________________________________________________________
dense_5 (Dense)              (None, 128)               8320      
_________________________________________________________________
dense_6 (Dense)              (None, 784)               101136    
=================================================================
Total params: 222,900
Trainable params: 222,900
Non-trainable params: 0
_________________________________________________________________
...(snip)...
test xentropy: 0.07924877260923385

出力されたグラフは次の通り。 今度の中間層の出力は、先ほどよりもパターンが出ているような気がする。 例えば、左上と右下にどの画像でも白くなっている出力があったりするようだ。

f:id:momijiame:20190908213602p:plain

そんなかんじで。

PythonとKerasによるディープラーニング

PythonとKerasによるディープラーニング

Python: pandas のデータ型をキャストしてメモリを節約してみる

pandas の DataFrame は明示的にデータ型を指定しないと整数型や浮動小数点型のカラムを 64 ビットで表現する。 pandas の DataFrame は、表現に使うビット数が大きいと、メモリ上のオブジェクトのサイズも当然ながら大きくなる。 そこで、今回は DataFrame の各カラムに含まれる値を調べながら、より小さなビット数の表現にキャストすることでメモリの使用量を節約してみる。 なお、ネットを調べると既に同じような実装が見つかったけど、自分でスクラッチしてみた。

今回使った環境は次の通り。

$ sw_vers
ProductName:    Mac OS X
ProductVersion: 10.14.6
BuildVersion:   18G95
$ python -V          
Python 3.7.4
$ pip list | grep -i pandas               
pandas          0.25.1 

下準備

まずは必要となるパッケージをインストールしておく。

$ pip install pandas tqdm seaborn

pandas のデータ型をキャストしてメモリを節約する

以下が DataFrame の各カラムのデータ型をキャストしてメモリを節約するサンプルコード。 例として 64 ビットで表現されているものの、実はもっと小さなビット数で表現できるデータを適用している。

#!/usr/bin/env python
# -*- coding: utf-8 -*-

from functools import partial
import logging

import numpy as np
import pandas as pd
from tqdm import tqdm


LOGGER = logging.getLogger(__name__)


def _fall_within_range(dtype_min_value, dtype_max_value, min_value, max_value):
    """データ型の表現できる範囲に収まっているか調べる関数"""
    if min_value < dtype_min_value:
        # 下限が越えている
        return False

    if max_value > dtype_max_value:
        # 上限が越えている
        return False

    # 範囲内に収まっている
    return True


def _cast(df, col_name, cast_candidates):
    # カラムに含まれる最小値と最大値を取り出す
    min_value, max_value = df[col_name].min(), df[col_name].max()

    for cast_type, (dtype_min_value, dtype_max_value) in cast_candidates.items():
        if df[col_name].dtype == cast_type:
            # 同じ型まで到達した時点で、キャストする意味はなくなる
            return

        if _fall_within_range(dtype_min_value, dtype_max_value, min_value, max_value):
            # キャストしたことをログに残す
            LOGGER.info(f'column {col_name} casted: {df[col_name].dtype.type} to {cast_type}')
            # 最も小さなビット数で表現できる型にキャストできたので終了
            df[col_name] = df[col_name].astype(cast_type)
            return


def _cast_func(df, col_name):
    col_type = df[col_name].dtype.type

    if issubclass(col_type, np.integer):
        # 整数型
        cast_candidates = {
            cast_type: (np.iinfo(cast_type).min, np.iinfo(cast_type).max)
            for cast_type in [np.int8, np.int16, np.int32]
        }
        return partial(_cast, cast_candidates=cast_candidates)

    if issubclass(col_type, np.floating):
        # 浮動小数点型
        cast_candidates = {
            cast_type: (np.finfo(cast_type).min, np.finfo(cast_type).max)
            for cast_type in [np.float16, np.float32]
        }
        return partial(_cast, cast_candidates=cast_candidates)

    # その他は未対応
    return None


def _memory_usage(df):
    """データフレームのサイズと接頭辞を返す"""
    units = ['B', 'kB', 'MB', 'GB']
    usage = float(df.memory_usage().sum())

    for unit in units:
        if usage < 1024:
            return usage, unit
        usage /= 1024

    return usage, unit


def shrink(df):
    # 元のサイズをログに記録しておく
    usage, unit = _memory_usage(df)
    LOGGER.info(f'original dataframe size: {usage:.0f}{unit}')

    for col_name in tqdm(df.columns):
        # 各カラムごとにより小さなビット数で表現できるか調べていく
        func = _cast_func(df, col_name)
        if func is None:
            continue
        func(df, col_name)

    # 事後のサイズをログに記録する
    usage, unit = _memory_usage(df)
    LOGGER.info(f'shrinked dataframe size: {usage:.0f}{unit}')


def main():
    log_fmt = '%(asctime)s - %(name)s - %(levelname)s - %(message)s'
    logging.basicConfig(format=log_fmt,
                        level=logging.DEBUG)

    data = [
        (2147483648, 32768, 129, 0, 2.0e+308, 65510.0, 0.0, 'foo'),
        (2147483649, 32769, 130, 1, 2.1e+308, 65520.0, 0.1, 'bar'),
    ]

    df = pd.DataFrame(data)
    print(df.dtypes)

    shrink(df)
    print(df.dtypes)


if __name__ == '__main__':
    main()

上記を実行してみよう。

$ python shrink.py
0      int64
1      int64
2      int64
3      int64
4    float64
5    float64
6    float64
7     object
dtype: object
2019-09-05 22:32:45,726 - __main__ - INFO - original dataframe size: 256B
  0%|                                                     | 0/8 [00:00<?, ?it/s]2019-09-05 22:32:45,742 - __main__ - INFO - column 1 casted: <class 'numpy.int64'> to <class 'numpy.int32'>
2019-09-05 22:32:45,743 - __main__ - INFO - column 2 casted: <class 'numpy.int64'> to <class 'numpy.int16'>
2019-09-05 22:32:45,744 - __main__ - INFO - column 3 casted: <class 'numpy.int64'> to <class 'numpy.int8'>
2019-09-05 22:32:45,746 - __main__ - INFO - column 5 casted: <class 'numpy.float64'> to <class 'numpy.float32'>
2019-09-05 22:32:45,748 - __main__ - INFO - column 6 casted: <class 'numpy.float64'> to <class 'numpy.float16'>
100%|███████████████████████████████████████████| 8/8 [00:00<00:00, 1066.51it/s]
2019-09-05 22:32:45,750 - __main__ - INFO - shrinked dataframe size: 202B
0      int64
1      int32
2      int16
3       int8
4    float64
5    float32
6    float16
7     object
dtype: object

上記の実行結果を確認すると、元は 256B だったデータサイズが 202B まで小さくなっている。 また、各カラムのデータ型も表現できる最小のビット数まで小さくなっていることもわかる。

もうちょっとちゃんとしたデータに対しても適用してみることにしよう。 seaborn からロードできる diamonds データセットを使ってみることにした。

#!/usr/bin/env python
# -*- coding: utf-8 -*-

from functools import partial
import logging

import seaborn
import numpy as np
import pandas as pd
from tqdm import tqdm


LOGGER = logging.getLogger(__name__)


def _fall_within_range(dtype_min_value, dtype_max_value, min_value, max_value):
    """データ型の表現できる範囲に収まっているか調べる関数"""
    if min_value < dtype_min_value:
        # 下限が越えている
        return False

    if max_value > dtype_max_value:
        # 上限が越えている
        return False

    # 範囲内に収まっている
    return True


def _cast(df, col_name, cast_candidates):
    # カラムに含まれる最小値と最大値を取り出す
    min_value, max_value = df[col_name].min(), df[col_name].max()

    for cast_type, (dtype_min_value, dtype_max_value) in cast_candidates.items():
        if df[col_name].dtype == cast_type:
            # 同じ型まで到達した時点で、キャストする意味はなくなる
            return

        if _fall_within_range(dtype_min_value, dtype_max_value, min_value, max_value):
            # キャストしたことをログに残す
            LOGGER.info(f'column {col_name} casted: {df[col_name].dtype.type} to {cast_type}')
            # 最も小さなビット数で表現できる型にキャストできたので終了
            df[col_name] = df[col_name].astype(cast_type)
            return


def _cast_func(df, col_name):
    col_type = df[col_name].dtype.type

    if issubclass(col_type, np.integer):
        # 整数型
        cast_candidates = {
            cast_type: (np.iinfo(cast_type).min, np.iinfo(cast_type).max)
            for cast_type in [np.int8, np.int16, np.int32]
        }
        return partial(_cast, cast_candidates=cast_candidates)

    if issubclass(col_type, np.floating):
        # 浮動小数点型
        cast_candidates = {
            cast_type: (np.finfo(cast_type).min, np.finfo(cast_type).max)
            for cast_type in [np.float16, np.float32]
        }
        return partial(_cast, cast_candidates=cast_candidates)

    # その他は未対応
    return None


def _memory_usage(df):
    """データフレームのサイズと接頭辞を返す"""
    units = ['B', 'kB', 'MB', 'GB']
    usage = float(df.memory_usage().sum())

    for unit in units:
        if usage < 1024:
            return usage, unit
        usage /= 1024

    return usage, unit


def shrink(df):
    # 元のサイズをログに記録しておく
    usage, unit = _memory_usage(df)
    LOGGER.info(f'original dataframe size: {usage:.0f}{unit}')

    for col_name in tqdm(df.columns):
        # 各カラムごとにより小さなビット数で表現できるか調べていく
        func = _cast_func(df, col_name)
        if func is None:
            continue
        func(df, col_name)

    # 事後のサイズをログに記録する
    usage, unit = _memory_usage(df)
    LOGGER.info(f'shrinked dataframe size: {usage:.0f}{unit}')


def main():
    log_fmt = '%(asctime)s - %(name)s - %(levelname)s - %(message)s'
    logging.basicConfig(format=log_fmt,
                        level=logging.DEBUG)

    df = seaborn.load_dataset('diamonds')

    print(df.dtypes)
    shrink(df)
    print(df.dtypes)


if __name__ == '__main__':
    main()

上記を実行した結果が次の通り。 元の DataFrame が 4MB だったのに対し、キャストした後は 2MB と半減していることがわかる。

$ python shrink.py
carat      float64
cut         object
color       object
clarity     object
depth      float64
table      float64
price        int64
x          float64
y          float64
z          float64
dtype: object
2019-09-05 22:38:13,848 - __main__ - INFO - original dataframe size: 4MB
  0%|          | 0/10 [00:00<?, ?it/s]2019-09-05 22:38:13,854 - __main__ - INFO - column carat casted: <class 'numpy.float64'> to <class 'numpy.float16'>
2019-09-05 22:38:13,858 - __main__ - INFO - column depth casted: <class 'numpy.float64'> to <class 'numpy.float16'>
2019-09-05 22:38:13,860 - __main__ - INFO - column table casted: <class 'numpy.float64'> to <class 'numpy.float16'>
2019-09-05 22:38:13,863 - __main__ - INFO - column price casted: <class 'numpy.int64'> to <class 'numpy.int16'>
2019-09-05 22:38:13,865 - __main__ - INFO - column x casted: <class 'numpy.float64'> to <class 'numpy.float16'>
2019-09-05 22:38:13,868 - __main__ - INFO - column y casted: <class 'numpy.float64'> to <class 'numpy.float16'>
2019-09-05 22:38:13,870 - __main__ - INFO - column z casted: <class 'numpy.float64'> to <class 'numpy.float16'>
100%|██████████| 10/10 [00:00<00:00, 538.64it/s]
2019-09-05 22:38:13,873 - __main__ - INFO - shrinked dataframe size: 2MB
carat      float16
cut         object
color       object
clarity     object
depth      float16
table      float16
price        int16
x          float16
y          float16
z          float16
dtype: object

大きなデータをオンメモリで扱うときは使える場面があるかもしれない。

Python: LightGBM で学習済みモデルを自動で永続化するコールバックを書いてみた

ニューラルネットワークを実装するためのフレームワークの Keras は LightGBM と似たようなコールバックの機構を備えている。 そして、いくつか標準で用意されているコールバックがある。

keras.io

そんな中に ModelCheckpoint というコールバックがあって、これが意外と便利そうだった。 このコールバックは良いスコアを記録したモデルを自動的にディスクに永続化するためのもの。 そこで、今回は似たような機能のコールバックを LightGBM に移植してみることにした。

使った環境は次の通り。

$ sw_vers
ProductName:    Mac OS X
ProductVersion: 10.14.6
BuildVersion:   18G95
$ python -V
Python 3.7.4

下準備

まずは今回使うパッケージをインストールしておく。

$ pip install lightgbm scikit-learn

自動でモデルを永続化してくれるコールバック

自動でモデルを保存してくれるコールバックを実装したサンプルコードが次の通り。 コールバックは ModelCheckpointCallback という名前のクラスとして実装している。 使い方はコメントを読むことで大体わかると思う。 チェックするメトリックのスコアが過去に記録されたものを上回ったときに、そのモデルをディスクに書き出す。 サンプルコードではコールバックによって保存された学習済みモデルを復元して、ホールドアウトしておいたデータを予測させている。

#!/usr/bin/env python
# -*- coding: utf-8 -*-

import pickle

import numpy as np
import lightgbm as lgb
from sklearn.metrics import accuracy_score
from sklearn import datasets
from sklearn.model_selection import train_test_split
from sklearn.model_selection import StratifiedKFold


class ModelCheckpointCallback(object):
    """モデルをディスクに永続化するためのコールバック"""

    def __init__(self, save_file, monitor_metric, pickle_protocol=2):
        # モデルを保存するファイルパス
        self._save_file = save_file
        # スコアを確認するメトリックの名前
        self._monitor_metric = monitor_metric
        # 永続化に使う pickle のプロトコル (デフォルトでは互換性優先)
        self._pickle_protocol = pickle_protocol
        self._best_score = None

    def _is_higher_score(self, metric_score, is_higher_better):
        if self._best_score is None:
            # 過去にスコアが記録されていなければ問答無用でベスト
            return True

        if is_higher_better:
            return metric_score < metric_score
        else:
            return metric_score > metric_score

    def _save_model(self, model):
        if isinstance(self._save_file, str):
            # 文字列ならファイルパスと仮定する
            with open(self._save_file, mode='wb') as fp:
                pickle.dump(model, fp,
                            protocol=self._pickle_protocol)
        else:
            # それ以外は File-like object と仮定する
            pickle.dump(model, self._save_file,
                        protocol=self._pickle_protocol)

    def __call__(self, env):
        evals = env.evaluation_result_list
        for _, name, score, is_higher_better, _ in evals:
            # チェックするメトリックを選別する
            if name != self._monitor_metric:
                continue
            # 対象のメトリックが見つかっても過去のスコアよりも性能が悪ければ何もしない
            if not self._is_higher_score(score, is_higher_better):
                return
            # ベストスコアならモデルを永続化する
            self._save_model(env.model)
            return
        # メトリックが見つからなかった
        raise ValueError('monitoring metric not found')


def accuracy(preds, data):
    """精度 (Accuracy) を計算する関数"""
    y_true = data.get_label()
    y_pred = np.where(preds > 0.5, 1, 0)
    acc = accuracy_score(y_true, y_pred)
    # name, result, is_higher_better
    return 'accuracy', acc, True


def main():
    # Iris データセットを読み込む
    dataset = datasets.load_breast_cancer()
    X, y = dataset.data, dataset.target

    # デモ用にデータセットを分割する
    X_train, X_test, y_train, y_test = train_test_split(X, y,
                                                        shuffle=True,
                                                        random_state=42)

    # LightGBM 用のデータセット表現に直す
    lgb_train = lgb.Dataset(X_train, y_train)

    # XXX: lightgbm.engine._CVBooster を pickle で永続化できるようにする
    #      lightgbm.train() で学習するときは不要な処理
    def __getstate__(self):
        return self.__dict__.copy()
    setattr(lgb.engine._CVBooster, '__getstate__', __getstate__)
    def __setstate__(self, state):
        self.__dict__.update(state)
    setattr(lgb.engine._CVBooster, '__setstate__', __setstate__)

    # 学習済みモデルを取り出すためのコールバックを用意する
    model_filename = 'lgb-cvbooster-model.pkl'
    checkpoint_cb = ModelCheckpointCallback(save_file=model_filename,
                                            monitor_metric='binary_logloss')
    callbacks = [
        checkpoint_cb,
    ]

    # データセットを 5-Fold CV で学習する
    lgbm_params = {
        'objective': 'binary',
        'metric': 'binary_logloss',
    }
    folds = StratifiedKFold(n_splits=5,
                            shuffle=True,
                            random_state=42)
    cv_result = lgb.cv(lgbm_params,
                       lgb_train,
                       num_boost_round=1000,
                       early_stopping_rounds=10,
                       folds=folds,
                       seed=42,
                       feval=accuracy,
                       callbacks=callbacks,
                       verbose_eval=10,
                       )

    # CV の結果を出力する
    print('eval accuracy:', cv_result['accuracy-mean'][-1])

    # 学習が終わったらモデルはディスクに永続化されている
    with open(model_filename, mode='rb') as fp:
        restored_model = pickle.load(fp)

    # 復元したモデルを使って Hold-out したデータを推論する
    y_pred_proba_list = restored_model.predict(X_test,
                                               restored_model.best_iteration)
    y_pred_probas = np.mean(y_pred_proba_list, axis=0)
    y_pred = np.where(y_pred_probas > 0.5, 1, 0)
    acc = accuracy_score(y_test, y_pred)
    print('test accuracy:', acc)


if __name__ == '__main__':
    main()

上記を実行してみよう。

$ python lgbcpcb.py
...(snip)...
eval accuracy: 0.9508305647840531
test accuracy: 0.958041958041958

ちゃんとテスト用にホールドアウトしておいたデータを予測できていることがわかる。

なお、ファイルシステムを確認するとカレントディレクトリにモデルが直列化されたファイルがあるはず。

$ file lgb-cvbooster-model.pkl
lgb-cvbooster-model.pkl: data

めでたしめでたし。

Python: Keras の学習曲線をコールバックで動的にプロットする

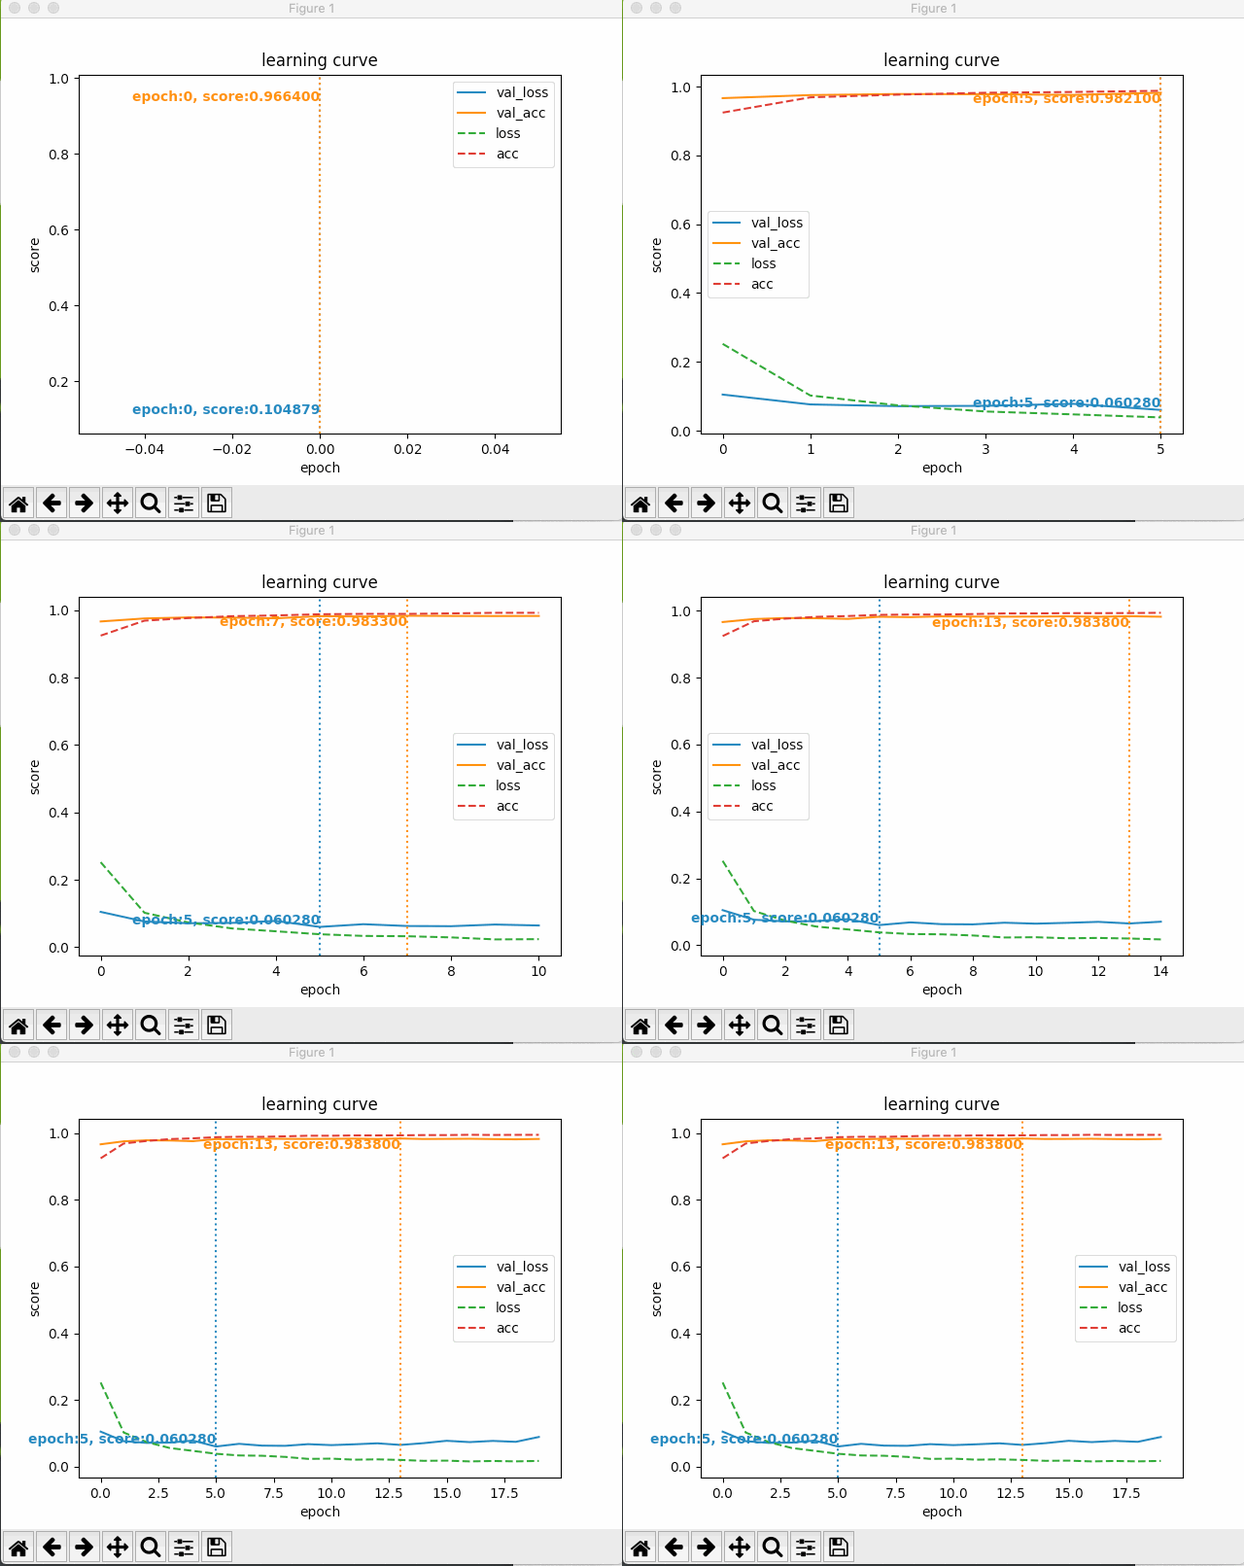
Keras でニューラルネットワークの学習が進む様子は一般的にコンソールの出力で確認できる。 しかし、もっと視覚的にリアルタイムで確認したいと考えて、今回はコールバックと Matplotlib を駆使して可視化してみることにした。

使った環境は次の通り。

$ sw_vers
ProductName:    Mac OS X
ProductVersion: 10.14.6
BuildVersion:   18G95
$ python -V         
Python 3.7.4
$ pip list | egrep -i "(keras|tensorflow)"
Keras                2.2.5  
Keras-Applications   1.0.8  
Keras-Preprocessing  1.1.0  
tensorflow           1.14.0 
tensorflow-estimator 1.14.0 

下準備

まずは今回使うパッケージをインストールしておく。

$ pip install keras tensorflow matplotlib

学習曲線を動的にプロットする

Keras で学習曲線を動的にプロットするサンプルコードが次の通り。 データセットには MNIST を使って、ニューラルネットワークは単純な MLP (Multi Layer Perceptron) にした。 可視化は LearningVisualizationCallback というクラスで実装している。 このクラスは keras.callbacks.Callback を継承していて、各エポックごとに呼ばれる on_epoch_end() メソッド内で学習曲線をプロットしている。

#!/usr/bin/env python
# -*- coding: utf-8 -*-

from collections import defaultdict

import numpy as np
from keras import callbacks
from keras.datasets import mnist
from keras.layers import Dense
from keras.layers import Dropout
from keras.losses import categorical_crossentropy
from keras.models import Sequential
from keras.utils import to_categorical
from keras import backend as K
import tensorflow as tf
from matplotlib import pyplot as plt
from tensorflow.python.client import device_lib


class LearningVisualizationCallback(callbacks.Callback):
    """学習曲線を可視化するためのコールバッククラス"""

    def __init__(self, higher_better_metrics, fig=None, ax=None):
        self._metric_histories = defaultdict(list)
        self._metric_history_lines = {}
        self._higher_better_metrics = set(higher_better_metrics)
        self._metric_type_higher_better = defaultdict(bool)
        self._best_score_vlines = {}
        self._best_score_texts = {}

        # 描画領域を初期化する
        self._fig = fig
        self._ax = ax
        if self._fig is None and self._ax is None:
            self._fig, self._ax = plt.subplots()
        self._ax.set_title('learning curve')
        self._ax.set_xlabel('epoch')
        self._ax.set_ylabel('score')
        self._fig.canvas.draw()
        self._fig.show()

    def on_epoch_end(self, epoch, logs=None):
        """各エポック毎に呼ばれるコールバック"""

        # 各メトリックのスコアを保存する
        for metric, score in logs.items():
            self._metric_histories[metric].append(score)

            # 初回だけの設定
            if epoch == 0:
                # メトリックの種別を保存する
                for higher_better_metric in self._higher_better_metrics:
                    if higher_better_metric in metric:
                        self._metric_type_higher_better[metric] = True
                        break
                # スコアの履歴を描画するオブジェクトを生成する
                history_line, = self._ax.plot([], [])
                self._metric_history_lines[metric] = history_line
                history_line.set_label(metric)
                if 'val' not in metric:
                    # 学習データのメトリックは検証データに比べると重要度が落ちるので点線
                    history_line.set_linestyle('--')
                else:
                    # ベストスコアの線を描画するオブジェクトを生成する
                    best_vline = self._ax.axvline(0)
                    best_vline.set_color(history_line.get_color())
                    best_vline.set_linestyle(':')
                    self._best_score_vlines[metric] = best_vline
                    # ベストスコアの文字列を描画するオブジェクトを生成する
                    vpos = 'top' if self._metric_type_higher_better[metric] else 'bottom'
                    best_text = self._ax.text(0, 0, '',
                                              va=vpos, ha='right', weight='bold')
                    best_text.set_color(history_line.get_color())
                    self._best_score_texts[metric] = best_text

        # 描画内容を更新する
        for metric, scores in self._metric_histories.items():
            # グラフデータを更新する
            history_line = self._metric_history_lines[metric]
            history_line.set_data(np.arange(len(scores)), scores)
            if 'val' in metric:
                if self._metric_type_higher_better[metric]:
                    best_score_find_func = np.max
                    best_epoch_find_func = np.argmax
                else:
                    best_score_find_func = np.min
                    best_epoch_find_func = np.argmin
                best_score = best_score_find_func(scores)
                # 縦線
                best_epoch = best_epoch_find_func(scores)
                best_vline = self._best_score_vlines[metric]
                best_vline.set_xdata(best_epoch)
                # テキスト
                best_text = self._best_score_texts[metric]
                best_text.set_text('epoch:{}, score:{:.6f}'.format(best_epoch, best_score))
                best_text.set_x(best_epoch)
                best_text.set_y(best_score)

        # グラフの見栄えを調整する
        self._ax.legend()
        self._ax.relim()
        self._ax.autoscale_view()

        # 再描画する
        plt.pause(0.001)

    def show_until_close(self):
        """ウィンドウを閉じるまで表示し続けるためのメソッド"""
        plt.show()


def main():
    # MNIST データセットを読み込む
    (x_train, y_train), (x_test, y_test) = mnist.load_data()

    # 入力画像の情報
    image_width, image_height = 28, 28
    num_classes = 10

    # Flatten
    x_train = x_train.reshape(x_train.shape[0], (image_height * image_width))
    x_test = x_test.reshape(x_test.shape[0], (image_height * image_width))

    # Min-Max Normalization
    x_train = x_train.astype('float32')
    x_test = x_test.astype('float32')
    x_train = (x_train - x_train.min()) / (x_train.max() - x_train.min())
    x_test = (x_test - x_test.min()) / (x_test.max() - x_test.min())

    # ラベル情報を One-Hot エンコードする
    y_train = to_categorical(y_train, num_classes)
    y_test = to_categorical(y_test, num_classes)

    # MLP (Multi Layer Perceptron) のネットワークを組む
    model = Sequential()
    model.add(Dense(512, activation='relu', input_shape=(784,)))
    model.add(Dropout(0.2))
    model.add(Dense(512, activation='relu'))
    model.add(Dropout(0.2))
    model.add(Dense(num_classes, activation='softmax'))

    # モデルをコンパイルする
    model.compile(loss=categorical_crossentropy,
                  optimizer='Adam',
                  metrics=['accuracy'])

    # 学習曲線を可視化するコールバックを用意する
    higher_better_metrics = ['acc']
    visualize_cb = LearningVisualizationCallback(higher_better_metrics)
    callbacks = [
        visualize_cb,
    ]

    # モデルを学習する
    model.fit(x_train, y_train,
              batch_size=128,
              epochs=20,
              verbose=1,
              validation_data=(x_test, y_test),
              # コールバックを登録する
              callbacks=callbacks,
              )

    # テストデータで評価する
    score = model.evaluate(x_test, y_test, verbose=0)
    print('Test loss:', score[0])
    print('Test accuracy:', score[1])

    # ウィンドウを閉じるまで表示し続ける
    visualize_cb.show_until_close()


if __name__ == '__main__':
    main()

上記を実行してみよう。

$ python kerasviz.py
...(snip)...
Test loss: 0.08890371433906939
Test accuracy: 0.9824

すると、次のように最初のエポック以降の学習状況がグラフにプロットされる。

f:id:momijiame:20190904224802g:plain

いじょう。

Python: LightGBM で Under-sampling + Bagging したモデルを Probability Calibration してみる

クラス間の要素数に偏りのある不均衡なデータに対する分類問題のアプローチとして、多いクラスのデータを減らすアンダーサンプリングという手法がある。 データをアンダーサンプリングしてモデルに学習させることで、評価指標が改善したりモデルの学習時間を削減できる。

ただし、アンダーサンプリングしたデータで学習させたモデルから得られる推論結果の確率にはバイアスが生じるらしい。 以下のブログでは、生じたバイアスを補正 (Probability Calibration) する方法が紹介されている。

pompom168.hatenablog.com

今回は、上記の手法をロジスティック回帰以外で試したときの結果が気になったので、やってみることにした。 モデルには LightGBM + Under-sampling + Bagging を選んだ。

使った環境は次の通り。

$ sw_vers
ProductName:    Mac OS X
ProductVersion: 10.14.6
BuildVersion:   18G87
$ python -V
Python 3.7.4

下準備

まずは下準備として必要なパッケージをインストールしておく。

$ pip install scikit-learn imbalanced-learn matplotlib lightgbm

ロジスティック回帰 + Under-sampling の場合

LightGBM で試す前に、前述したブログを追試してみる。 ちょっと長いけどサンプルコードは以下の通り。 各種評価指標と、グラフとしてはキャリブレーションカーブを出力してみた。

#!/usr/bin/env python
# -*- coding: utf-8 -*-

import numpy as np
from sklearn.calibration import calibration_curve
from sklearn.model_selection import train_test_split
from sklearn.datasets import make_classification
from sklearn.linear_model import LogisticRegression
from sklearn import metrics
from imblearn.under_sampling import RandomUnderSampler
from matplotlib import pyplot as plt


def probability_calibration(y_proba, beta):
    """サンプリングレートを元に確率を補正する"""
    calibrated_proba = y_proba / (y_proba + (1 - y_proba) / beta)
    return calibrated_proba


def main():
    # クラス比が 0.9 : 0.1 の不均衡な二値分類データを作る
    X, y = make_classification(n_samples=100_000,
                               n_features=5,
                               n_classes=2,
                               weights=[0.9, 0.1],
                               random_state=42)

    # 学習用データと検証用データに分割する (Hold-out)
    X_train, X_test, y_train, y_test = train_test_split(X, y,
                                                        test_size=0.2,
                                                        random_state=42)

    # まずは不均衡データのままロジスティック回帰モデルを学習させる
    clf = LogisticRegression(random_state=42, solver='lbfgs')
    clf.fit(X_train, y_train)
    # 検証用データを予測させる
    y_pred_proba_base = clf.predict_proba(X_test)[:, 1]
    y_pred_base = np.where(y_pred_proba_base > 0.5, 1, 0)

    # Under-sampling で均衡データにする
    sampler = RandomUnderSampler(random_state=42)
    X_train_sampled, y_train_sampled = sampler.fit_sample(X_train, y_train)

    # 均衡データでロジスティック回帰モデルを学習させる
    clf = LogisticRegression(random_state=42, solver='lbfgs')
    clf.fit(X_train_sampled, y_train_sampled)
    # 検証用データを予測させる
    y_pred_proba_us = clf.predict_proba(X_test)[:, 1]
    y_pred_us = np.where(y_pred_proba_us > 0.5, 1, 0)

    # サンプリングレートを元に確率を補正する
    y_train_zero_len = np.count_nonzero(y_train_sampled == 0)
    beta = y_train_zero_len / len(y_train)
    y_pred_proba_cb = probability_calibration(y_pred_proba_us,
                                              beta)
    y_pred_cb = np.where(y_pred_proba_cb > 0.5, 1, 0)

    # 各種評価指標を出力する
    print('precision (base): ',
          metrics.precision_score(y_test, y_pred_base))
    print('precision (under-sampling): ',
          metrics.precision_score(y_test, y_pred_us))
    print('precision (calibrated): ',
          metrics.precision_score(y_test, y_pred_cb))
    print('recall (base): ',
          metrics.recall_score(y_test, y_pred_base))
    print('recall (under-sampling): ',
          metrics.recall_score(y_test, y_pred_us))
    print('recall (calibrated): ',
          metrics.recall_score(y_test, y_pred_cb))
    print('F1 (base): ',
          metrics.f1_score(y_test, y_pred_base))
    print('F1 (under-sampling): ',
          metrics.f1_score(y_test, y_pred_us))
    print('F1 (calibrated): ',
          metrics.f1_score(y_test, y_pred_cb))
    print('ROC AUC (base): ',
          metrics.roc_auc_score(y_test, y_pred_base))
    print('ROC AUC (under-sampling): ',
          metrics.roc_auc_score(y_test, y_pred_us))
    print('ROC AUC (calibrated): ',
          metrics.roc_auc_score(y_test, y_pred_cb))

    # 各モデルが予測した内容の統計量
    print('y_test mean', y_test.mean())
    print('y_proba mean (base)', y_pred_proba_base.mean())
    print('y_proba mean (under-sampling)', y_pred_proba_us.mean())
    print('y_proba mean (calibrated)', y_pred_proba_cb.mean())

    # キャリブレーションカーブを計算する
    base_curve = calibration_curve(y_test, y_pred_proba_base,
                                   n_bins=10)
    undersampling_curve = calibration_curve(y_test, y_pred_proba_us,
                                           n_bins=10)
    calibrated_curve = calibration_curve(y_test, y_pred_proba_cb,
                                         n_bins=10)

    # プロットする
    fig, axes = plt.subplots(2, 1, figsize=(8, 7))

    ax1 = axes[0]
    ax1.plot([0, 1], [0, 1], 'k:', label='Perfectly calibrated')
    ax1.plot(base_curve[0], base_curve[1],
             label='base')
    ax1.plot(undersampling_curve[0], undersampling_curve[1],
             label='under-sampling')
    ax1.plot(calibrated_curve[0], calibrated_curve[1],
             label='calibrated')

    ax1.grid()
    ax1.set_ylabel('Fraction of positives')
    ax1.set_xlabel('Prediction probability')
    ax1.set_ylim([-0.05, 1.05])
    ax1.legend(loc='lower right')

    ax2 = axes[1]
    ax2.hist(y_pred_proba_base, bins=144, alpha=0.5,
             color='red', label='y_pred_proba (base)')
    ax2.hist(y_pred_proba_us, bins=144, alpha=0.5,
             color='orange', label='y_pred_proba (under-sampling)')
    ax2.hist(y_pred_proba_cb, bins=144, alpha=0.5,
             color='green', label='y_pred_proba (calibrated)')
    ax2.axvline(x=y_test.mean(),
                color='blue', label='y_test mean')
    ax2.axvline(x=y_pred_proba_base.mean(),
                color='red', label='y_proba mean (base)')
    ax2.axvline(x=y_pred_proba_us.mean(),
                color='orange', label='y_proba mean (under-sampling)')
    ax2.axvline(x=y_pred_proba_cb.mean(),
                color='green', label='y_proba mean (calibrated)')

    ax2.set_xlabel('Prediction Probability')
    ax2.set_ylabel('Frequency')

    plt.legend()
    plt.show()


if __name__ == '__main__':
    main()

上記を実行してみよう。 標準出力の前半は、各種評価指標を以下の条件で計算している。

  • アンダーサンプリングしていないデータを学習させたモデルが出力した確率値 (base)
  • アンダーサンプリングしたデータを学習させたモデルが出力した確率値 (under-sampling)
  • アンダーサンプリングしたデータを学習させたモデルが出力した確率値を補正した確率値 (calibrated)

後半は、それぞれが出力した確率値の平均になる。

precision (base):  0.7960526315789473
precision (under-sampling):  0.4034117104656524
precision (calibrated):  0.8048582995951417
recall (base):  0.5203057811753464
recall (under-sampling):  0.8361204013377926
recall (calibrated):  0.47491638795986624
F1 (base):  0.6292978907830107
F1 (under-sampling):  0.5442388431037164
F1 (calibrated):  0.5973557692307693
ROC AUC (base):  0.7523626409646208
ROC AUC (under-sampling):  0.8457979568536285
ROC AUC (calibrated):  0.7307289819399487
y_test mean 0.10465
y_proba mean (base) 0.10308716245156492
y_proba mean (under-sampling) 0.2733953199075095
y_proba mean (calibrated) 0.09521502104917157

上記を見ると、評価指標によってはアンダーサンプリングが有効に作用している様子が伺える。 また、補正済みの確率値を使った評価指標では、アンダーサンプリングしなかった場合の結果に近づいていることが分かる。 そして、モデルの出力した確率値の平均も興味深い。 真のテスト用データの平均が 0.10465 なのに対して、アンダーサンプリングなしでは 0.10308 と、割と良い線いってる。 それに比べてアンダーサンプリングすると 0.27339 と大きくバイアスがかかっていることが分かる。 そして、補正したものでは 0.0952 と、真の平均に近づけられている。

より詳しくグラフにプロットしたものが以下の通り。 上の図は Q-Q プロットのようなもので、陽性データの真の出現頻度とモデルの予測を比較している。 理想的な状況では斜めに一直線になる。 下の図はモデルが出力した確率値のヒストグラムと、確率の平均値になっている。

f:id:momijiame:20190825010912p:plain

上記を見ると、アンダーサンプリングしたデータを使って学習させたモデルの出力には大きなバイアスが生じていることが分かる。 それに対して補正したデータではバイアスが減少している。

上記の結果より、確率を補正するとアンダーサンプリングしないデータを使って学習させたモデルの出力を再生するような印象を受けた。

LightGBM + Undersampling + Bagging の場合

それでは、先ほどと同じことを LightGBM でアンダーサンプリングしつつ、モデルを 5-Fold で Bagging した場合でも試してみよう。

サンプルコードは次の通り。

#!/usr/bin/env python
# -*- coding: utf-8 -*-

import numpy as np
import lightgbm as lgb
from sklearn.calibration import calibration_curve
from sklearn.model_selection import BaseCrossValidator
from sklearn.model_selection import train_test_split
from sklearn.datasets import make_classification
from sklearn import metrics
from imblearn.under_sampling import RandomUnderSampler
from matplotlib import pyplot as plt


def probability_calibration(y_proba, beta):
    '''サンプリングレートを元に確率を補正する'''
    calibrated_proba = y_proba / (y_proba + (1 - y_proba) / beta)
    return calibrated_proba


class UnderBaggingKFold(BaseCrossValidator):
    '''CV に使うだけで UnderBagging できる KFold 実装

    NOTE: 少ないクラスのデータは各 Fold で重複して選択される'''

    def __init__(self, n_splits=5, shuffle=True, random_states=None,
                 test_size=0.2, whole_testing=False):
        '''
        :param n_splits: Fold の分割数
        :param shuffle: 分割時にデータをシャッフルするか
        :param random_states: 各 Fold の乱数シード
        :param test_size: Under-sampling された中でテスト用データとして使う割合
        :param whole_testing: Under-sampling で選ばれなかった全てのデータをテスト用データに追加するか
        '''
        self.n_splits = n_splits
        self.shuffle = shuffle
        self.random_states = random_states
        self.test_size = test_size
        self.whole_testing = whole_testing

        self.sample_indices_ = []

        if random_states is not None:
            # 各 Fold の乱数シードが指定されているなら分割数をそれに合わせる
            self.n_splits = len(random_states)
        else:
            # 乱数シードが指定されていないときは分割数だけ None で埋めておく
            self.random_states = [None] * self.n_splits

        # 分割数だけ Under-sampling 用のインスタンスを作っておく
        self.samplers_ = [
            RandomUnderSampler(random_state=random_state)
            for random_state in self.random_states
        ]

    def split(self, X, y=None, groups=None):
        '''データを学習用とテスト用に分割する'''
        if X.ndim < 2:
            # RandomUnderSampler#fit_resample() は X が 1d-array だと文句を言う
            X = np.vstack(X)

        for i in range(self.n_splits):
            # データを Under-sampling して均衡データにする
            sampler = self.samplers_[i]
            _, y_sampled = sampler.fit_resample(X, y)
            # 選ばれたデータのインデックスを取り出す
            sampled_indices = sampler.sample_indices_

            # 選ばれたデータのインデックスを記録しておく
            self.sample_indices_ = sampled_indices

            # 選ばれたデータを学習用とテスト用に分割する
            split_data = train_test_split(sampled_indices,
                                          shuffle=self.shuffle,
                                          test_size=self.test_size,
                                          stratify=y_sampled,
                                          random_state=self.random_states[i],
                                          )
            train_indices, test_indices = split_data

            if self.whole_testing:
                # Under-sampling で選ばれなかったデータをテスト用に追加する
                mask = np.ones(len(X), dtype=np.bool)
                mask[sampled_indices] = False
                X_indices = np.arange(len(X))
                non_sampled_indices = X_indices[mask]
                test_indices = np.concatenate([test_indices,
                                               non_sampled_indices])

            yield train_indices, test_indices

    def get_n_splits(self, X=None, y=None, groups=None):
        return self.n_splits


class ModelExtractionCallback(object):
    '''lightgbm.cv() から学習済みモデルを取り出すためのコールバックに使うクラス

    NOTE: 非公開クラス '_CVBooster' に依存しているため将来的に動かなく恐れがある
    '''

    def __init__(self):
        self._model = None

    def __call__(self, env):
        # _CVBooster の参照を保持する
        self._model = env.model

    def _assert_called_cb(self):
        if self._model is None:
            # コールバックが呼ばれていないときは例外にする
            raise RuntimeError('callback has not called yet')

    @property
    def boosters_proxy(self):
        self._assert_called_cb()
        # Booster へのプロキシオブジェクトを返す
        return self._model

    @property
    def raw_boosters(self):
        self._assert_called_cb()
        # Booster のリストを返す
        return self._model.boosters

    @property
    def best_iteration(self):
        self._assert_called_cb()
        # Early stop したときの boosting round を返す
        return self._model.best_iteration


def main():
    # 不均衡な二値分類データを作る
    X, y = make_classification(n_samples=100_000,
                               n_features=5,
                               n_classes=2,
                               weights=[0.9, 0.1],
                               random_state=42)

    # 学習用データと検証用データに分割する (Hold-out)
    X_train, X_test, y_train, y_test = train_test_split(X, y,
                                                        test_size=0.2,
                                                        random_state=42)

    # まずは不均衡データのまま学習させる
    lgb_params = {
        'objective': 'binary',
        'metric': 'binary_logloss',
    }
    X_tr, X_ev, y_tr, y_ev = train_test_split(X_train, y_train,
                                              test_size=0.2,
                                              random_state=42)
    lgb_train = lgb.Dataset(X_tr, y_tr)
    lgb_eval = lgb.Dataset(X_ev, y_ev, reference=lgb_train)
    booster = lgb.train(lgb_params, lgb_train, valid_sets=lgb_eval,
                        num_boost_round=1000,
                        early_stopping_rounds=10,
                        verbose_eval=10)
    # 検証用データを予測させる
    y_pred_proba_base = booster.predict(X_test)
    y_pred_base = np.where(y_pred_proba_base > 0.5, 1, 0)

    # 均衡データで学習させる (UnderBagging)
    folds = UnderBaggingKFold(random_states=range(42, 42 + 5))
    lgb_train = lgb.Dataset(X_train, y_train)
    extraction_cb = ModelExtractionCallback()
    callbacks = [
        extraction_cb,
    ]
    lgb.cv(lgb_params, lgb_train,
           num_boost_round=1000,
           early_stopping_rounds=10,
           folds=folds,
           callbacks=callbacks,
           verbose_eval=10)
    cv_booster = extraction_cb.boosters_proxy
    # 検証用データを予測させる
    y_pred_proba_ub_list = cv_booster.predict(X_test)
    y_pred_proba_ub = np.array(y_pred_proba_ub_list).mean(axis=0)
    y_pred_ub = np.where(y_pred_proba_ub > 0.5, 1, 0)

    # サンプリングレートを元に確率を補正する
    y_sampled = y_train[folds.sample_indices_]
    y_sampled_negative_len = np.count_nonzero(y_sampled == 0)
    beta = y_sampled_negative_len / len(y_train)
    y_pred_proba_cb = probability_calibration(y_pred_proba_ub,
                                              beta)
    y_pred_cb = np.where(y_pred_proba_cb > 0.5, 1, 0)

    # 各種評価指標を出力する
    print('precision (base): ',
          metrics.precision_score(y_test, y_pred_base))
    print('precision (under-bagging): ',
          metrics.precision_score(y_test, y_pred_ub))
    print('precision (calibrated): ',
          metrics.precision_score(y_test, y_pred_cb))
    print('recall (base): ',
          metrics.recall_score(y_test, y_pred_base))
    print('recall (under-bagging): ',
          metrics.recall_score(y_test, y_pred_ub))
    print('recall (calibrated): ',
          metrics.recall_score(y_test, y_pred_cb))
    print('F1 (base): ',
          metrics.f1_score(y_test, y_pred_base))
    print('F1 (under-bagging): ',
          metrics.f1_score(y_test, y_pred_ub))
    print('F1 (calibrated): ',
          metrics.f1_score(y_test, y_pred_cb))
    print('ROC AUC (base): ',
          metrics.roc_auc_score(y_test, y_pred_base))
    print('ROC AUC (under-bagging): ',
          metrics.roc_auc_score(y_test, y_pred_ub))
    print('ROC AUC (calibrated): ',
          metrics.roc_auc_score(y_test, y_pred_cb))

    # 各モデルが予測した内容の統計量
    print('y_test mean', y_test.mean())
    print('y_proba mean (base)', y_pred_proba_base.mean())
    print('y_proba mean (under-sampling)', y_pred_proba_ub.mean())
    print('y_proba mean (calibrated)', y_pred_proba_cb.mean())

    # キャリブレーションカーブを計算する
    base_curve = calibration_curve(y_test, y_pred_proba_base,
                                   n_bins=10)
    underbagging_curve = calibration_curve(y_test, y_pred_proba_ub,
                                           n_bins=10)
    calibrated_curve = calibration_curve(y_test, y_pred_proba_cb,
                                         n_bins=10)

    # プロットする
    fig, axes = plt.subplots(2, 1, figsize=(8, 7))

    ax1 = axes[0]
    ax1.plot([0, 1], [0, 1], 'k:', label='Perfectly calibrated')
    ax1.plot(base_curve[0], base_curve[1],
             label='base')
    ax1.plot(underbagging_curve[0], underbagging_curve[1],
             label='under-bagging')
    ax1.plot(calibrated_curve[0], calibrated_curve[1],
             label='calibrated')

    ax1.grid()
    ax1.set_ylabel('Fraction of positives')
    ax1.set_xlabel('Prediction probability')
    ax1.set_ylim([-0.05, 1.05])
    ax1.legend(loc='lower right')

    ax2 = axes[1]
    ax2.hist(y_pred_proba_base, bins=144, alpha=0.5,
             color='red', label='y_pred_proba (base)')
    ax2.hist(y_pred_proba_ub, bins=144, alpha=0.5,
             color='orange', label='y_pred_proba (under-bagging)')
    ax2.hist(y_pred_proba_cb, bins=144, alpha=0.5,
             color='green', label='y_pred_proba (calibrated)')
    ax2.axvline(x=y_test.mean(),
                color='blue', label='y_test mean')
    ax2.axvline(x=y_pred_proba_base.mean(),
                color='red', label='y_proba mean (base)')
    ax2.axvline(x=y_pred_proba_ub.mean(),
                color='orange', label='y_proba mean (under-bagging)')
    ax2.axvline(x=y_pred_proba_cb.mean(),
                color='green', label='y_proba mean (calibrated)')

    ax2.set_xlabel('Prediction Probability')
    ax2.set_ylabel('Frequency')

    plt.legend()
    plt.show()


if __name__ == '__main__':
    main()

上記の実行結果は次の通り。

$ python lgbm.py
...(snip)...
precision (base):  0.8451915559030493
precision (under-bagging):  0.39481204660364916
precision (calibrated):  0.8634105960264901
recall (base):  0.5164835164835165
recall (under-bagging):  0.8580984233158147
recall (calibrated):  0.4983277591973244
F1 (base):  0.6411625148279954
F1 (under-bagging):  0.5408009635651913
F1 (calibrated):  0.6319297182671918
ROC AUC (base):  0.7527131939931404
ROC AUC (under-bagging):  0.8521798309687914
ROC AUC (calibrated):  0.7445567427248139
y_test mean 0.10465
y_proba mean (base) 0.10305398392930754
y_proba mean (under-sampling) 0.26559621708983305
y_proba mean (calibrated) 0.09724228389477375

各種評価指標と確率の平均値については、先ほどと同じような振る舞いを見せている。

グラフについては次の通り。

f:id:momijiame:20190825012519p:plain

こちらも、ロジスティック回帰と同様にアンダーサンプリングで生じたバイアスが低減できていることが分かる。

いじょう。

Python: Under-sampling + Bagging なモデルを簡単に作れる K-Fold を実装してみた

不均衡データに対する分類問題のアプローチとして、多いクラスのデータを取り除く Under-sampling という手法がある。 さらに、複数の Under-sampling したデータを用いて、複数のモデルを用意する Bagging という手法を組み合わせることがある。 今回は、そんな Under-sampling + Bagging (UnderBagging) なモデルを簡単に作れる KFold を実装してみた。

Under-sampling + Bagging に関する既知の実装としては imbalanced-learnBalancedBaggingClassifier という分類器がある。 ただ、このアプローチだと、学習させる分類器が scikit-learn の API を備えている必要がある。 そこで、異なるアプローチとしてモデルではなくデータを K-Fold するタイミングで Under-sampling + Bagging してみることにした。

使った環境は次の通り。

$ sw_vers            
ProductName:    Mac OS X
ProductVersion: 10.14.6
BuildVersion:   18G87
$ python -V
Python 3.7.4

下準備

まずは今回使うパッケージをインストールしておく。

$ pip install scikit-learn imbalanced-learn lightgbm

データを分割するタイミングで Under-sampling する K-Fold の実装

早速だけど以下にサンプルコードを示す。 具体的には UnderBaggingKFold という名前で scikit-learn の CrossValidation API を実装している。 データを K-Fold 分割するタイミングで imbalanced-learn の RandomUnderSampler を使って Under-sampling している。 なお、このサンプルコードは動作をデモするためのものなので、まだ分類器にデータを渡すことまではしていない。

#!/usr/bin/env python
# -*- coding: utf-8 -*-

import numpy as np
from sklearn.model_selection import BaseCrossValidator
from sklearn.model_selection import train_test_split
from imblearn.under_sampling import RandomUnderSampler


class UnderBaggingKFold(BaseCrossValidator):
    """CV に使うだけで UnderBagging できる KFold 実装

    NOTE: 少ないクラスのデータは各 Fold で重複して選択される"""

    def __init__(self, n_splits=5, shuffle=True, random_states=None,
                 test_size=0.2, whole_testing=False):
        """
        :param n_splits: Fold の分割数
        :param shuffle: 分割時にデータをシャッフルするか
        :param random_states: 各 Fold の乱数シード
        :param test_size: Under-sampling された中でテスト用データとして使う割合
        :param whole_testing: Under-sampling で選ばれなかった全てのデータをテスト用データに追加するか
        """
        self.n_splits = n_splits
        self.shuffle = shuffle
        self.random_states = random_states
        self.test_size = test_size
        self.whole_testing = whole_testing

        if random_states is not None:
            # 各 Fold の乱数シードが指定されているなら分割数をそれに合わせる
            self.n_splits = len(random_states)
        else:
            # 乱数シードが指定されていないときは分割数だけ None で埋めておく
            self.random_states = [None] * self.n_splits

        # 分割数だけ Under-sampling 用のインスタンスを作っておく
        self.samplers_ = [
            RandomUnderSampler(random_state=random_state)
            for random_state in self.random_states
        ]

    def split(self, X, y=None, groups=None):
        """データを学習用とテスト用に分割する"""
        if X.ndim < 2:
            # RandomUnderSampler#fit_resample() は X が 1d-array だと文句を言う
            X = np.vstack(X)

        for i in range(self.n_splits):
            # データを Under-sampling して均衡データにする
            sampler = self.samplers_[i]
            _, y_sampled = sampler.fit_resample(X, y)
            # 選ばれたデータのインデックスを取り出す
            sampled_indices = sampler.sample_indices_

            # 選ばれたデータを学習用とテスト用に分割する
            split_data = train_test_split(sampled_indices,
                                          shuffle=self.shuffle,
                                          test_size=self.test_size,
                                          stratify=y_sampled,
                                          random_state=self.random_states[i],
                                          )
            train_indices, test_indices = split_data

            if self.whole_testing:
                # Under-sampling で選ばれなかったデータをテスト用に追加する
                mask = np.ones(len(X), dtype=np.bool)
                mask[sampled_indices] = False
                X_indices = np.arange(len(X))
                non_sampled_indices = X_indices[mask]
                test_indices = np.concatenate([test_indices,
                                               non_sampled_indices])

            yield train_indices, test_indices

    def get_n_splits(self, X=None, y=None, groups=None):
        return self.n_splits


def main():
    # ダミーの不均衡データを用意する
    X, y = np.arange(1, 21), np.zeros(20, dtype=np.int8)
    # 先頭の 4 要素だけ陽性 (Positive) データに指定する
    y[:4] = 1

    print('y:', y)

    # 乱数シードを指定した 5-Fold
    folds = UnderBaggingKFold(random_states=range(5))

    # データの分割され方を出力する
    for train_indices, test_indices in folds.split(X, y):
        print('train: X={X}, y={y}'.format(X=train_indices, y=y[train_indices]))
        print('test: X={X}, y={y}'.format(X=test_indices, y=y[test_indices]))


if __name__ == '__main__':
    main()

上記のサンプルコードを実行してみよう。 デモでは、全体が 20 要素ある中で先頭の 4 要素だけ陽性になった不均衡なデータを分割している。 各 Fold で、学習データとテスト用データがどのように分割されるか観察してみよう。

$ python ubkfold.py 
y: [1 1 1 1 0 0 0 0 0 0 0 0 0 0 0 0 0 0 0 0]
train: X=[13  0  2 12 10  1], y=[0 1 1 0 0 1]
test: X=[3 5], y=[1 0]
train: X=[ 7  0 11  2  6  1], y=[0 1 0 1 0 1]
test: X=[17  3], y=[0 1]
train: X=[3 1 0 4 8 9], y=[1 1 1 0 0 0]
test: X=[16  2], y=[0 1]
train: X=[ 0  2 17 11  1  5], y=[1 1 0 0 1 0]
test: X=[3 8], y=[1 0]
train: X=[ 2  3  0  4  7 16], y=[1 1 1 0 0 0]
test: X=[10  1], y=[0 1]

上記を見ると、全ての目的変数 (y) について陽性と陰性が均等に含まれた均衡データになっていることが分かる。

ちなみに whole_testing というオプションに True を渡すと、サンプリングされなかったデータが全てテスト用データに追加される。 まあ、ようするに陰性のデータが大量に突っ込まれる。

    # サンプリングされなかったデータを全てテスト用に追加する
    folds = UnderBaggingKFold(random_states=range(5),
                              whole_testing=True)

上記についても動作を確認しておこう。 学習用のデータに関しては先ほどと変化がないものの、テスト用のデータは陰性の要素が増えていることが分かる。

$ python ubkfold.py 
y: [1 1 1 1 0 0 0 0 0 0 0 0 0 0 0 0 0 0 0 0]
train: X=[13  0  2 12 10  1], y=[0 1 1 0 0 1]
test: X=[ 3  5  4  6  7  8  9 11 14 15 16 17 18 19], y=[1 0 0 0 0 0 0 0 0 0 0 0 0 0]
train: X=[ 7  0 11  2  6  1], y=[0 1 0 1 0 1]
test: X=[17  3  4  5  8  9 10 12 13 14 15 16 18 19], y=[0 1 0 0 0 0 0 0 0 0 0 0 0 0]
train: X=[3 1 0 4 8 9], y=[1 1 1 0 0 0]
test: X=[16  2  5  6  7 10 11 12 13 14 15 17 18 19], y=[0 1 0 0 0 0 0 0 0 0 0 0 0 0]
train: X=[ 0  2 17 11  1  5], y=[1 1 0 0 1 0]
test: X=[ 3  8  4  6  7  9 10 12 13 14 15 16 18 19], y=[1 0 0 0 0 0 0 0 0 0 0 0 0 0]
train: X=[ 2  3  0  4  7 16], y=[1 1 1 0 0 0]
test: X=[10  1  5  6  8  9 11 12 13 14 15 17 18 19], y=[0 1 0 0 0 0 0 0 0 0 0 0 0 0]

LightGBM で Under-sampling + Bagging してみる

振る舞いの説明ができたので、続いては実際に分類器を学習させてみよう。 とりあえず LightGBM に擬似的に作った不均衡データを与えてみることにする。

#!/usr/bin/env python
# -*- coding: utf-8 -*-

import time
from contextlib import contextmanager

import lightgbm as lgb
import numpy as np
from sklearn.datasets import make_classification
from sklearn.model_selection import BaseCrossValidator
from sklearn.model_selection import train_test_split
from imblearn.under_sampling import RandomUnderSampler


class UnderBaggingKFold(BaseCrossValidator):
    """CV に使うだけで UnderBagging できる KFold 実装

    NOTE: 少ないクラスのデータは各 Fold で重複して選択される"""

    def __init__(self, n_splits=5, shuffle=True, random_states=None,
                 test_size=0.2, whole_testing=False):
        """
        :param n_splits: Fold の分割数
        :param shuffle: 分割時にデータをシャッフルするか
        :param random_states: 各 Fold の乱数シード
        :param test_size: Under-sampling された中でテスト用データとして使う割合
        :param whole_testing: Under-sampling で選ばれなかった全てのデータをテスト用データに追加するか
        """
        self.n_splits = n_splits
        self.shuffle = shuffle
        self.random_states = random_states
        self.test_size = test_size
        self.whole_testing = whole_testing

        if random_states is not None:
            # 各 Fold の乱数シードが指定されているなら分割数をそれに合わせる
            self.n_splits = len(random_states)
        else:
            # 乱数シードが指定されていないときは分割数だけ None で埋めておく
            self.random_states = [None] * self.n_splits

        # 分割数だけ Under-sampling 用のインスタンスを作っておく
        self.samplers_ = [
            RandomUnderSampler(random_state=random_state)
            for random_state in self.random_states
        ]

    def split(self, X, y=None, groups=None):
        """データを学習用とテスト用に分割する"""
        if X.ndim < 2:
            # RandomUnderSampler#fit_resample() は X が 1d-array だと文句を言う
            X = np.vstack(X)

        for i in range(self.n_splits):
            # データを Under-sampling して均衡データにする
            sampler = self.samplers_[i]
            _, y_sampled = sampler.fit_resample(X, y)
            # 選ばれたデータのインデックスを取り出す
            sampled_indices = sampler.sample_indices_

            # 選ばれたデータを学習用とテスト用に分割する
            split_data = train_test_split(sampled_indices,
                                          shuffle=self.shuffle,
                                          test_size=self.test_size,
                                          stratify=y_sampled,
                                          random_state=self.random_states[i],
                                          )
            train_indices, test_indices = split_data

            if self.whole_testing:
                # Under-sampling で選ばれなかったデータをテスト用に追加する
                mask = np.ones(len(X), dtype=np.bool)
                mask[sampled_indices] = False
                X_indices = np.arange(len(X))
                non_sampled_indices = X_indices[mask]
                test_indices = np.concatenate([test_indices,
                                               non_sampled_indices])

            yield train_indices, test_indices

    def get_n_splits(self, X=None, y=None, groups=None):
        return self.n_splits


@contextmanager
def stopwatch():
    """学習にかかる時間を計測するためのコンテキストマネージャ"""
    before = time.time()
    yield
    after = time.time()
    print(f'elapsed time: {after - before:.2f} sec')


def main():
    # クラス比 0.99 : 0.01 のダミーデータを用意する
    args = {
        'n_samples': 1_000_000,
        'n_features': 80,
        'n_informative': 3,
        'n_redundant': 0,
        'n_repeated': 0,
        'n_classes': 2,
        'n_clusters_per_class': 1,
        'weights': [0.99, 0.01],
        'random_state': 42,
    }
    X, y = make_classification(**args)

    # メトリックに ROC AUC を用いた二値分類問題として解く
    lgbm_params = {
        'objective': 'binary',
        'metric': 'auc',
    }
    lgb_train = lgb.Dataset(X, y)

    # 5-Fold で乱数シードに 42 ~ 46 を指定している
    folds = UnderBaggingKFold(random_states=range(42, 42 + 5))

    with stopwatch():
        # 上記で作った UnderBaggingKFold を folds に指定する
        result = lgb.cv(lgbm_params,
                        lgb_train,
                        num_boost_round=1000,
                        early_stopping_rounds=10,
                        seed=42,
                        folds=folds,
                        verbose_eval=10,
                        )
    print('under-bagging auc:', result['auc-mean'][-1])


if __name__ == '__main__':
    main()

上記を実行してみよう。 今回使った環境では、学習に約 28 秒かかって ROC AUC では約 0.776 という結果が得られた。

$ python ublgbm.py
...(snip)...
elapsed time: 28.62 sec
under-bagging auc: 0.7760463716175261

ちなみに LightGBM.cv() 関数から学習済みモデルを取り出す方法については次のエントリを参照してほしい。

blog.amedama.jp

比較対象として LightGBM の単なる Bagging も確認する

先ほどの結果を見るだけでは、学習が早いのか遅いのか、性能が良いのか悪いのか判断が難しい。 そのため、比較対象として Under-sampling しない、単なる Bagging の検証もしておく。

#!/usr/bin/env python
# -*- coding: utf-8 -*-

import time
from contextlib import contextmanager

import lightgbm as lgb
from sklearn.datasets import make_classification
from sklearn.model_selection import StratifiedKFold


@contextmanager
def stopwatch():
    before = time.time()
    yield
    after = time.time()
    print(f'elapsed time: {after - before:.2f} sec')


def main():
    args = {
        'n_samples': 1_000_000,
        'n_features': 80,
        'n_informative': 3,
        'n_redundant': 0,
        'n_repeated': 0,
        'n_classes': 2,
        'n_clusters_per_class': 1,
        'weights': [0.99, 0.01],
        'random_state': 42,
    }
    X, y = make_classification(**args)

    lgbm_params = {
        'objective': 'binary',
        'metric': 'auc',
    }
    lgb_train = lgb.Dataset(X, y)

    # 一般的な Stratified KFold
    folds = StratifiedKFold(n_splits=5,
                            shuffle=True,
                            random_state=42)

    with stopwatch():
        # アンダーサンプリングなしで学習する
        result = lgb.cv(lgbm_params,
                        lgb_train,
                        num_boost_round=1000,
                        early_stopping_rounds=10,
                        seed=42,
                        folds=folds,
                        verbose_eval=10,
                        )
    print('base auc:', result['auc-mean'][-1])


if __name__ == '__main__':
    main()

上記の実行結果は次の通り。 学習にかかった時間は約 38 秒で、ROC AUC は約 0.779 だった。

$ python baselgbm.py
...(snip)...
elapsed time: 38.79 sec
base auc: 0.7791468600807205

RandomForest でも Under-sampling + Bagging してみる

続いては scikit-learn の RandomForest でも Under-sampling + Bagging を試してみよう。 このケースでは cross_validate()cv オプションに UnderBaggingKFold のインスタンスを渡せば良い。 ちなみに、学習済みモデルは return_estimatorTrue にすれば受け取れる。

#!/usr/bin/env python
# -*- coding: utf-8 -*-

import time
from contextlib import contextmanager

import lightgbm as lgb
import numpy as np
from sklearn.datasets import make_classification
from sklearn.ensemble import RandomForestClassifier
from sklearn.model_selection import BaseCrossValidator
from sklearn.model_selection import cross_validate
from sklearn.model_selection import train_test_split
from imblearn.under_sampling import RandomUnderSampler


class UnderBaggingKFold(BaseCrossValidator):
    """CV に使うだけで UnderBagging できる KFold 実装

    NOTE: 少ないクラスのデータは各 Fold で重複して選択される"""

    def __init__(self, n_splits=5, shuffle=True, random_states=None,
                 test_size=0.2, whole_testing=False):
        """
        :param n_splits: Fold の分割数
        :param shuffle: 分割時にデータをシャッフルするか
        :param random_states: 各 Fold の乱数シード
        :param test_size: Under-sampling された中でテスト用データとして使う割合
        :param whole_testing: Under-sampling で選ばれなかった全てのデータをテスト用データに追加するか
        """
        self.n_splits = n_splits
        self.shuffle = shuffle
        self.random_states = random_states
        self.test_size = test_size
        self.whole_testing = whole_testing

        if random_states is not None:
            # 各 Fold の乱数シードが指定されているなら分割数をそれに合わせる
            self.n_splits = len(random_states)
        else:
            # 乱数シードが指定されていないときは分割数だけ None で埋めておく
            self.random_states = [None] * self.n_splits

        # 分割数だけ Under-sampling 用のインスタンスを作っておく
        self.samplers_ = [
            RandomUnderSampler(random_state=random_state)
            for random_state in self.random_states
        ]

    def split(self, X, y=None, groups=None):
        """データを学習用とテスト用に分割する"""
        if X.ndim < 2:
            # RandomUnderSampler#fit_resample() は X が 1d-array だと文句を言う
            X = np.vstack(X)

        for i in range(self.n_splits):
            # データを Under-sampling して均衡データにする
            sampler = self.samplers_[i]
            _, y_sampled = sampler.fit_resample(X, y)
            # 選ばれたデータのインデックスを取り出す
            sampled_indices = sampler.sample_indices_

            # 選ばれたデータを学習用とテスト用に分割する
            split_data = train_test_split(sampled_indices,
                                          shuffle=self.shuffle,
                                          test_size=self.test_size,
                                          stratify=y_sampled,
                                          random_state=self.random_states[i],
                                          )
            train_indices, test_indices = split_data

            if self.whole_testing:
                # Under-sampling で選ばれなかったデータをテスト用に追加する
                mask = np.ones(len(X), dtype=np.bool)
                mask[sampled_indices] = False
                X_indices = np.arange(len(X))
                non_sampled_indices = X_indices[mask]
                test_indices = np.concatenate([test_indices,
                                               non_sampled_indices])

            yield train_indices, test_indices

    def get_n_splits(self, X=None, y=None, groups=None):
        return self.n_splits


@contextmanager
def stopwatch():
    before = time.time()
    yield
    after = time.time()
    print(f'elapsed time: {after - before:.2f} sec')


def main():
    args = {
        'n_samples': 1_000_000,
        'n_features': 80,
        'n_informative': 3,
        'n_redundant': 0,
        'n_repeated': 0,
        'n_classes': 2,
        'n_clusters_per_class': 1,
        'weights': [0.99, 0.01],
        'random_state': 42,
    }
    X, y = make_classification(**args)

    folds = UnderBaggingKFold(random_states=range(42, 42 + 5))

    # 分類器としてランダムフォレストを使う
    clf = RandomForestClassifier(n_estimators=100,
                                 n_jobs=-1,
                                 verbose=1,
                                 random_state=42)

    folds = UnderBaggingKFold(random_states=range(42, 42 + 5))

    with stopwatch():
        # cross_validate() 関数の 'cv' オプションに渡す
        result = cross_validate(clf, X, y,
                                scoring='roc_auc',
                                cv=folds, return_estimator=True)

    mean_score = np.array(result['test_score']).mean()
    print('rf auc:', mean_score)


if __name__ == '__main__':
    main()

上記の実行結果は次の通り。 ただし、この実験では学習時間や性能がどうのというより、複数の異なる API に対応しやすいことを示している。

$ python ubrf.py
...(snip)...
elapsed time: 110.35 sec
rf auc: 0.7572552391326518

注意事項

今回実装した K-Fold は、交差検証でモデルの性能を正しく見積もることよりも、モデルを学習させることに重きを置いている。 特に、少ないラベルを重複して選択するところにその側面が強く現れている。 そのため、モデルの性能を検証するという点では、Nested CV の要領でさらに外側にもう一段交差検証を重ねた方が良いかもしれない。

blog.amedama.jp

参考資料

blog.amedama.jp

upura.hatenablog.com

いじょう。

Python: PySpark でサードパーティ製のライブラリを使って分散処理する

今回は PySpark でサードパーティ製のライブラリを使って分散処理をする方法について。

サンプルとして、次のような状況を試した。

  • Apache Spark + Hadoop YARN で構築した分散処理用のクラスタを用いる
  • サードパーティ製のライブラリとして scikit-learn を想定する
  • scikit-learn の学習済みモデルを、あらかじめローカルで用意しておく
  • Iris データセットと学習済みモデルを使った推論を PySpark で分散処理する

使った環境は次の通り。

$ cat /etc/redhat-release
CentOS Linux release 7.6.1810 (Core)
$ uname -r
3.10.0-957.21.3.el7.x86_64
$ python3 -V
Python 3.6.8
$ pyspark --version
Welcome to
      ____              __
     / __/__  ___ _____/ /__
    _\ \/ _ \/ _ `/ __/  '_/
   /___/ .__/\_,_/_/ /_/\_\   version 2.4.3
      /_/

Using Scala version 2.11.12, OpenJDK 64-Bit Server VM, 1.8.0_222
Branch
Compiled by user  on 2019-05-01T05:08:38Z
Revision
Url
Type --help for more information.
$ hadoop version
Hadoop 2.9.2
Subversion https://git-wip-us.apache.org/repos/asf/hadoop.git -r 826afbeae31ca687bc2f8471dc841b66ed2c6704
Compiled by ajisaka on 2018-11-13T12:42Z
Compiled with protoc 2.5.0
From source with checksum 3a9939967262218aa556c684d107985
This command was run using /home/vagrant/hadoop-2.9.2/share/hadoop/common/hadoop-common-2.9.2.jar

Conda (Miniconda) で Python の仮想環境を作る

PySpark でサードパーティ製のライブラリを使う場合、いくつか検討すべき点がある。 その中でも、最初につまづくのは「ライブラリをいかにエグゼキュータのホストに配布するか」という点。 なぜなら、事前にエグゼキュータの各ホストにライブラリをインストールして回ることは現実的ではない。 Apache Spark のエグゼキュータのホストは環境によっては数百や数千台に及ぶ可能性もある。 管理が自動化されていることは前提としても、各アプリケーションごとにライブラリを追加する作業が生じるのは望ましくない。 そのため、あらかじめライブラリをインストールした仮想環境またはコンテナなどを実行時に配布する方が良い。

今回は Conda (Miniconda) で事前に作った仮想環境をエグゼキュータに配布する方法を取った。 これは、Conda で作った仮想環境はポータビリティがあるため。 virtualenv で作った仮想環境は、ベースとなった Python の実行環境に依存するためホストをまたいだポータビリティがない。 実験的なオプションとして提供されている --relocatableをつければできそうではあるけど、ドキュメントを読む限りあまり使う気持ちにはならない。

virtualenv.pypa.io

なので、まずは Miniconda をインストールしていく。

$ sudo yum -y install wget bzip2 zip
$ wget https://repo.anaconda.com/miniconda/Miniconda3-latest-Linux-x86_64.sh
$ sudo bash Miniconda3-latest-Linux-x86_64.sh -b -p /opt/conda

インストールした Conda で仮想環境を作る。 以下では環境の名前を conda_env としている。

$ /opt/conda/bin/conda create -n conda_env --copy -yq python=3.7

次のように、仮想環境ができた。

$ source /opt/conda/bin/activate conda_env
$ pip list
Package    Version
---------- ---------
certifi    2019.6.16
pip        19.1.1
setuptools 41.0.1
wheel      0.33.4

仮想環境に、PySpark のアプリケーションが動作するのに必要なサードパーティ製のライブラリをインストールする。 今回であれば scikit-learn を入れる。

$ pip install scikit-learn

インストールできたら、次は仮想環境のある場所に移動して ZIP ファイルに圧縮する。 これはエグゼキュータへの配布を考えてのこと。

$ cd ~/.conda/envs
$ zip -r conda_env.zip conda_env

PySpark で動作確認する

さて、仮想環境の準備ができたところで動作確認に移る。

まずは PySpark のインタプリタを起動しよう。

$ pyspark \
  --master yarn \
  --archives "conda_env.zip#defrost" \
  --conf spark.pyspark.driver.python=conda_env/bin/python \
  --conf spark.pyspark.python=defrost/conda_env/bin/python

上記では、クラスタ管理に Hadoop YARN を使っているので --master yarn で起動している。 そして、今回のポイントとなるのがそれ以降のオプションたち。 まず、--archives オプションはエグゼキュータに配布するファイルを指定している。 ここで、先ほど作った ZIP ファイルを指定することでエグゼキュータに Conda の仮想環境をバラまいている。 また、# 以降はファイルを解凍したときのディレクトリ名になる。 続いて --conf spark.pyspark.driver.python では Spark のドライバで使う Python を指定している。 ここでも先ほど作った仮想環境の Python を指定した。 そして、最大のポイントとなるのが --conf spark.pyspark.python で、ここでエグゼキュータのホスト上に解凍されたディレクトリに含まれる仮想環境の Python を指定している。

インタプリタが起動したら動作を確認していこう。 まず、ドライバで起動したインタプリタは次の通り Python 3.7 になっている。 ちゃんと Conda で作った仮想環境が使われているようだ。

>>> import sys
>>> sys.version_info
sys.version_info(major=3, minor=7, micro=4, releaselevel='final', serial=0)

しかし、エグゼキュータの方はどうだろうか? こちらも確認する必要がある。 そこで、まずは次のようにダミーの RDD を用意しておく。

>>> rdd = sc.range(2)
>>> rdd.getNumPartitions()
2

そして、次のように Python のバージョンを返す関数を定義しておく。

>>> def python_version(_):
...     """エグゼキュータ上の Python のバージョンを返す"""
...     import sys
...     return str(sys.version_info)
...

上記を先ほど作った RDD に対して実行することで、エグゼキュータ上の Python のバージョンを確認してみよう。

>>> from pprint import pprint
>>> pprint(rdd.map(python_version).collect())
["sys.version_info(major=3, minor=7, micro=4, releaselevel='final', serial=0)",
 "sys.version_info(major=3, minor=7, micro=4, releaselevel='final', serial=0)"]

上記の通り、ちゃんとエグゼキュータ上でも Python 3.7 が使えている。

とはいえ、まだ油断はできない。 ちゃんと scikit-learn はインポートできるだろうか? これについても確認しておく。

>>> def sklearn_version(_):
...     """エグゼキュータ上で scikit-learn をインポートしてバージョンを返す関数"""
...     import sklearn
...     return sklearn.__version__
...
 >>> pprint(rdd.map(sklearn_version).collect())
['0.21.3', '0.21.3']

どうやら、ちゃんとエグゼキュータ上で scikit-learn が使える状況にあるようだ。

ローカルで学習済みモデルを作る

分散環境で scikit-learn が使えるようになったところで、次にローカルで学習済みモデルを用意する。 とはいえ、めんどくさいのでインタプリタは先ほど起動したものを使い回すことにしよう。 PySpark の環境は、いくつかのインスタンスがグローバルスコープにある以外は通常の Python と何ら変わりがないので。

Iris データセットを読み込む。

>>> from sklearn import datasets
>>> dataset = datasets.load_iris()
>>> X, y = dataset.data, dataset.target

ホールドアウト検証用にデータを分割する。

>>> from sklearn.model_selection import train_test_split
>>> X_train, X_test, y_train, y_test = train_test_split(X, y,
...                                                     shuffle=True,
...                                                     random_state=42)

学習データの方をランダムフォレストに学習させる。

>>> clf = RandomForestClassifier(n_estimators=100)
>>> clf.fit(X_train, y_train)
RandomForestClassifier(bootstrap=True, class_weight=None, criterion='gini',
                       max_depth=None, max_features='auto', max_leaf_nodes=None,
                       min_impurity_decrease=0.0, min_impurity_split=None,
                       min_samples_leaf=1, min_samples_split=2,
                       min_weight_fraction_leaf=0.0, n_estimators=100,
                       n_jobs=None, oob_score=False, random_state=None,
                       verbose=0, warm_start=False)

これで学習済みモデルが手に入った。 通常であれば pickle などを使ってディスクに直列化して別の環境に持ち運ぶことになる。 今回はインタプリタが変わらないので、そのまま使うことにする。

データセットを PySpark のデータ表現に変換する

学習済みモデルができたので、次はこれを PySpark で動かしたい。 ただ、その前にデータがないと始まらないので Iris データセットを PySpark に読み込む。 具体的には NumPy の配列を PySpark の DataFrame に変換したい。

まずは PySpark の DataFrame を作るためにスキーマを定義する。 今回は特徴量が全て浮動小数点型だったので楽だけど、異なるときは型を変えていく必要がある。

>>> from pyspark.sql.types import StructType
>>> from pyspark.sql.types import StructField
>>> from pyspark.sql.types import DoubleType
>>> df_schema = StructType([
...     StructField(feature_name, DoubleType(), False)
...     for feature_name in dataset.feature_names
... ])

PySpark は Numpy の配列を受け付けてくれないのでプリミティブな型に変換する関数を用意する。 まあ、実際には Numpy の配列をデータセットとして PySpark の環境に持っていくことなんてそうないだろうけど。

>>> def numpy_to_primitive(np_array):
...     """numpy の要素があると受け付けないので Python のネイティブな型に直す"""
...     for np_row in np_array:
...         yield [float(element) for element in np_row]
...

先ほどホールドアウトしておいたテストデータを DataFrame に変換する。

>>> X_test_df = spark.createDataFrame(numpy_to_primitive(X_test), df_schema)
>>> X_test_df.show(truncate=False, n=5)
+-----------------+----------------+-----------------+----------------+
|sepal length (cm)|sepal width (cm)|petal length (cm)|petal width (cm)|
+-----------------+----------------+-----------------+----------------+
|6.1              |2.8             |4.7              |1.2             |
|5.7              |3.8             |1.7              |0.3             |
|7.7              |2.6             |6.9              |2.3             |
|6.0              |2.9             |4.5              |1.5             |
|6.8              |2.8             |4.8              |1.4             |
+-----------------+----------------+-----------------+----------------+
only showing top 5 rows

これでデータができた。

PySpark で学習済みモデルの推論を分散処理する

データセットとモデルが揃ったので、次は本題となる推論の部分を分散処理する。

まずは学習済みモデルを SparkContext#broadcast() を使ってエグゼキュータのインタプリタ上で使えるようにする。 これは要するにオブジェクトを SerDe してリモートのホスト上のインタプリタにロードしている。

>>> broadcasted_clf = sc.broadcast(clf)
>>> broadcasted_clf
<pyspark.broadcast.Broadcast object at 0x7fe46aa4f8d0>

まずはデータを一行ずつ推論させてみることにしよう。 今回であれば row は Iris データセットの一つの花の特徴量に対応する。 SparkContext#broadcast() でバラまいたオブジェクトは Broadcast#value アトリビュートからアクセスできる。

>>> def predict(row):
...     """推論を分散処理する"""
...     y_pred = broadcasted_clf.value.predict([row])
...     # 返り値が numpy の配列なので単なるリストに直したほうが PySpark では扱いやすい
...     return list(y_pred)
...

上記を使って推論してみよう。 DataFrame を RDD に変換した上で、RDD#flatMap() で分散処理を実行している。

>>> X_test_df.rdd.flatMap(predict).collect()
[1, 0, 2, 1, 1, 0, 1, 2, 1, 1, 2, 0, 0, 0, 0, 1, 2, 1, 1, 2, 0, 2, 0, 2, 2, 2, 2, 2, 0, 0, 0, 0, 1, 0, 0, 2, 1, 0]

どうやら、それっぽい値が得られた。

RDD#flatMap() にしているのは、返しているのがリストだからで、もし単なる RDD#map() だと、次のようにリストの入れ子になる。

>>> X_test_df.rdd.map(predict).collect()
[[1], [0], [2], [1], [1], [0], [1], [2], [1], [1], [2], [0], [0], [0], [0], [1], [2], [1], [1], [2], [0], [2], [0], [2], [2], [2], [2], [2], [0], [0], [0], [0], [1], [0], [0], [2], [1], [0]]

得られた結果を Accuracy について評価してみよう。

>>> y_pred = X_test_df.rdd.flatMap(predict).collect()
>>> from sklearn.metrics import accuracy_score
>>> accuracy_score(y_test, y_pred)
1.0

どうやら、ちゃんと推論できたようだ。

続いては複数行をまとめて推論させてみることにしよう。 Apache Spark では、パーティションという単位でデータをまとまりとして扱うことができる。 以下の関数は複数行のデータを受け取れるようにしてある。

>>> def predict_partition(map_of_rows):
...     """パーティション単位で推論を分散処理する"""
...     list_of_rows = list(map_of_rows)  # 複数行のデータが入ったリストに直す
...     y_pred = broadcasted_clf.value.predict(list_of_rows)
...     return y_pred
...

上記を実行してみよう。 パーティション単位で処理するときは RDD#mapPartitions() を使う。

>>> X_test_df.rdd.mapPartitions(predict_partition).collect()
[1, 0, 2, 1, 1, 0, 1, 2, 1, 1, 2, 0, 0, 0, 0, 1, 2, 1, 1, 2, 0, 2, 0, 2, 2, 2, 2, 2, 0, 0, 0, 0, 1, 0, 0, 2, 1, 0]

こちらも、Accuracy で評価してみよう。 先ほどの結果と一致しているだろうか。

>>> y_pred = X_test_df.rdd.mapPartitions(predict_partition).collect()
>>> accuracy_score(y_test, y_pred)
1.0

どうやら、大丈夫そうだ。

めでたしめでたし。

参考

blog.cloudera.co.jp

入門 PySpark ―PythonとJupyterで活用するSpark 2エコシステム

入門 PySpark ―PythonとJupyterで活用するSpark 2エコシステム