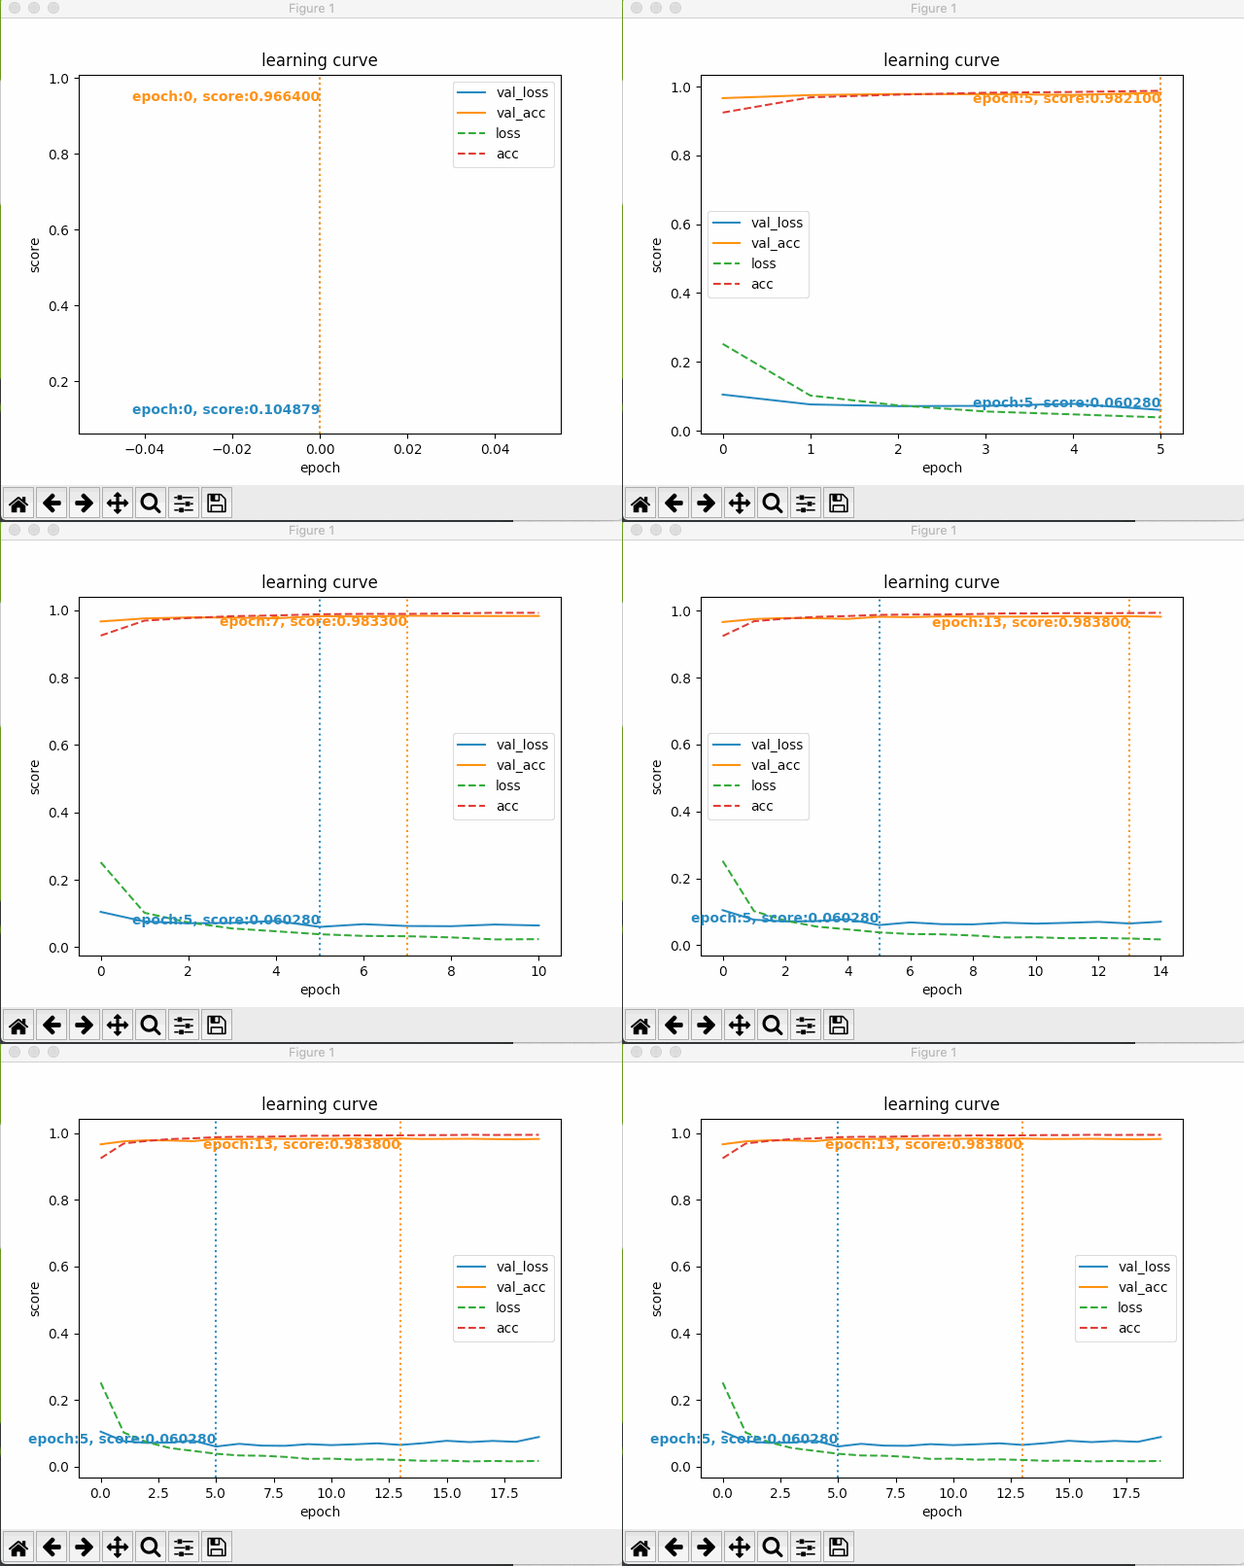
Keras でニューラルネットワークの学習が進む様子は一般的にコンソールの出力で確認できる。 しかし、もっと視覚的にリアルタイムで確認したいと考えて、今回はコールバックと Matplotlib を駆使して可視化してみることにした。
使った環境は次の通り。
$ sw_vers
ProductName:    Mac OS X
ProductVersion: 10.14.6
BuildVersion:   18G95
$ python -V
Python 3.7.4
$ pip list | egrep -i "(keras|tensorflow)"
Keras                2.2.5
Keras-Applications   1.0.8
Keras-Preprocessing  1.1.0
tensorflow           1.14.0
tensorflow-estimator 1.14.0
下準備
まずは今回使うパッケージをインストールしておく。
$ pip install keras tensorflow matplotlib
学習曲線を動的にプロットする
Keras で学習曲線を動的にプロットするサンプルコードが次の通り。
データセットには MNIST を使って、ニューラルネットワークは単純な MLP (Multi Layer Perceptron) にした。
可視化は LearningVisualizationCallback というクラスで実装している。
このクラスは keras.callbacks.Callback を継承していて、各エポックごとに呼ばれる on_epoch_end() メソッド内で学習曲線をプロットしている。
#!/usr/bin/env python
# -*- coding: utf-8 -*-

from collections import defaultdict

import numpy as np
from keras import callbacks
from keras.datasets import mnist
from keras.layers import Dense
from keras.layers import Dropout
from keras.losses import categorical_crossentropy
from keras.models import Sequential
from keras.utils import to_categorical
from keras import backend as K
import tensorflow as tf
from matplotlib import pyplot as plt
from tensorflow.python.client import device_lib


class LearningVisualizationCallback(callbacks.Callback):
    """学習曲線を可視化するためのコールバッククラス"""

    def __init__(self, higher_better_metrics, fig=None, ax=None):
        self._metric_histories = defaultdict(list)
        self._metric_history_lines = {}
        self._higher_better_metrics = set(higher_better_metrics)
        self._metric_type_higher_better = defaultdict(bool)
        self._best_score_vlines = {}
        self._best_score_texts = {}

        # 描画領域を初期化する
        self._fig = fig
        self._ax = ax
        if self._fig is None and self._ax is None:
            self._fig, self._ax = plt.subplots()
        self._ax.set_title('learning curve')
        self._ax.set_xlabel('epoch')
        self._ax.set_ylabel('score')
        self._fig.canvas.draw()
        self._fig.show()

    def on_epoch_end(self, epoch, logs=None):
        """各エポック毎に呼ばれるコールバック"""

        # 各メトリックのスコアを保存する
        for metric, score in logs.items():
            self._metric_histories[metric].append(score)

            # 初回だけの設定
            if epoch == 0:
                # メトリックの種別を保存する
                for higher_better_metric in self._higher_better_metrics:
                    if higher_better_metric in metric:
                        self._metric_type_higher_better[metric] = True
                        break
                # スコアの履歴を描画するオブジェクトを生成する
                history_line, = self._ax.plot([], [])
                self._metric_history_lines[metric] = history_line
                history_line.set_label(metric)
                if 'val' not in metric:
                    # 学習データのメトリックは検証データに比べると重要度が落ちるので点線
                    history_line.set_linestyle('--')
                else:
                    # ベストスコアの線を描画するオブジェクトを生成する
                    best_vline = self._ax.axvline(0)
                    best_vline.set_color(history_line.get_color())
                    best_vline.set_linestyle(':')
                    self._best_score_vlines[metric] = best_vline
                    # ベストスコアの文字列を描画するオブジェクトを生成する
                    vpos = 'top' if self._metric_type_higher_better[metric] else 'bottom'
                    best_text = self._ax.text(0, 0, '',
                                              va=vpos, ha='right', weight='bold')
                    best_text.set_color(history_line.get_color())
                    self._best_score_texts[metric] = best_text

        # 描画内容を更新する
        for metric, scores in self._metric_histories.items():
            # グラフデータを更新する
            history_line = self._metric_history_lines[metric]
            history_line.set_data(np.arange(len(scores)), scores)
            if 'val' in metric:
                if self._metric_type_higher_better[metric]:
                    best_score_find_func = np.max
                    best_epoch_find_func = np.argmax
                else:
                    best_score_find_func = np.min
                    best_epoch_find_func = np.argmin
                best_score = best_score_find_func(scores)
                # 縦線
                best_epoch = best_epoch_find_func(scores)
                best_vline = self._best_score_vlines[metric]
                best_vline.set_xdata(best_epoch)
                # テキスト
                best_text = self._best_score_texts[metric]
                best_text.set_text('epoch:{}, score:{:.6f}'.format(best_epoch, best_score))
                best_text.set_x(best_epoch)
                best_text.set_y(best_score)

        # グラフの見栄えを調整する
        self._ax.legend()
        self._ax.relim()
        self._ax.autoscale_view()

        # 再描画する
        plt.pause(0.001)

    def show_until_close(self):
        """ウィンドウを閉じるまで表示し続けるためのメソッド"""
        plt.show()


def main():
    # MNIST データセットを読み込む
    (x_train, y_train), (x_test, y_test) = mnist.load_data()

    # 入力画像の情報
    image_width, image_height = 28, 28
    num_classes = 10

    # Flatten
    x_train = x_train.reshape(x_train.shape[0], (image_height * image_width))
    x_test = x_test.reshape(x_test.shape[0], (image_height * image_width))

    # Min-Max Normalization
    x_train = x_train.astype('float32')
    x_test = x_test.astype('float32')
    x_train = (x_train - x_train.min()) / (x_train.max() - x_train.min())
    x_test = (x_test - x_test.min()) / (x_test.max() - x_test.min())

    # ラベル情報を One-Hot エンコードする
    y_train = to_categorical(y_train, num_classes)
    y_test = to_categorical(y_test, num_classes)

    # MLP (Multi Layer Perceptron) のネットワークを組む
    model = Sequential()
    model.add(Dense(512, activation='relu', input_shape=(784,)))
    model.add(Dropout(0.2))
    model.add(Dense(512, activation='relu'))
    model.add(Dropout(0.2))
    model.add(Dense(num_classes, activation='softmax'))

    # モデルをコンパイルする
    model.compile(loss=categorical_crossentropy,
                  optimizer='Adam',
                  metrics=['accuracy'])

    # 学習曲線を可視化するコールバックを用意する
    higher_better_metrics = ['acc']
    visualize_cb = LearningVisualizationCallback(higher_better_metrics)
    callbacks = [
        visualize_cb,
    ]

    # モデルを学習する
    model.fit(x_train, y_train,
              batch_size=128,
              epochs=20,
              verbose=1,
              validation_data=(x_test, y_test),
              # コールバックを登録する
              callbacks=callbacks,
              )

    # テストデータで評価する
    score = model.evaluate(x_test, y_test, verbose=0)
    print('Test loss:', score[0])
    print('Test accuracy:', score[1])

    # ウィンドウを閉じるまで表示し続ける
    visualize_cb.show_until_close()


if __name__ == '__main__':
    main()
上記を実行してみよう。
$ python kerasviz.py
...(snip)...
Test loss: 0.08890371433906939
Test accuracy: 0.9824
すると、次のように最初のエポック以降の学習状況がグラフにプロットされる。

いじょう。

スマートPythonプログラミング: Pythonのより良い書き方を学ぶ
- 作者: もみじあめ
- 発売日: 2016/03/12
- メディア: Kindle版
- この商品を含むブログ (1件) を見る