CUBE SUGAR CONTAINER

技術系のこと書きます。

Python: 条件分岐と真偽値周りの話

今回は Python の条件分岐と真偽値周りの話について。 ざっくりと内容をまとめると次の通り。

  • Python の条件分岐には真偽値以外のオブジェクトを渡せる
    • 意味的には組み込み関数 bool() にオブジェクトを渡すのと等価になる
  • ただし条件分岐に真偽値以外のオブジェクトを渡すと不具合を生みやすい
    • そのため、条件分岐には真偽値だけを渡すようにした方が良い
  • なお、オブジェクトを bool() に渡したときの振る舞いはオーバーライドできる
    • 特殊メソッド __bool__() を実装すれば良い

使った環境は次の通り。

$ sw_vers 
ProductName:    Mac OS X
ProductVersion: 10.14.4
BuildVersion:   18E226
$ python -V
Python 3.7.3

下準備

今回の説明は Python の REPL を使って進めていくので、あらかじめ起動しておく。

$ python

Python の条件分岐について

Python の条件分岐には真偽値 (bool ) 型以外のオブジェクトも渡せる。 例えば、次のコードは Python においてちゃんと動作する。 関数 f() における引数 x は bool 型である必要もない。

>>> def f(x):
...     # 引数が有効か無効かを判断するつもりの条件分岐
...     if x:
...         print('Valid')
...     else:
...         print('Invalid')
... 

では、上記の引数 x に色々なオブジェクトを渡すと、どのように振る舞うだろうか。 ちょっと見てみよう。

例えば真偽値型の True を渡してみる。 これは、当然ながら上のコードブロックに遷移する。

>>> f(True)
Valid

では、長さのある文字列だったら? これも、上のコードブロックに遷移する。

>>> f('Hello, World!')
Valid

非 0 の整数なら? これまた同様。

>>> f(1)
Valid

では、続いて None を渡してみよう。

>>> f(None)
Invalid

この場合は、下のコードブロックに遷移した。 なんとなく、ここまでは直感どおりに思える。

じゃあ長さのない文字列 (空文字) を渡したらどうなるだろう。

>>> f('')
Invalid

なんと、この場合は下のコードブロックに遷移してしまった。

整数としてゼロを渡した場合も同様。

>>> f(0)
Invalid

では、上記の不思議な振る舞いは一体何に由来するものだろうか。 実はオブジェクトを条件分岐に渡すとき、意味的には組み込み関数 bool() に渡すのと等価になる。

つまり、最初に示した関数 f() は、次のコードと等価ということになる。

>>> def f(x):
...     # オブジェクトの真偽値表現を組み込み関数 bool() で取得する
...     if bool(x):
...         print('Valid')
...     else:
...         print('Invalid')
... 

組み込み関数 bool() では、オブジェクトを真偽値として評価した場合の結果が得られる。 先ほど試したいくつかのオブジェクトを実際に渡してみよう。

>>> bool('')
False
>>> bool(' ')
True
>>> bool(0)
False
>>> bool(1)
True

上記で得られる返り値の内容は、先ほどの検証で得られた振る舞いと一致する。

このように、真偽値以外のオブジェクトを条件分岐に渡すと直感的でない振る舞いをすることがある。 コードの直感的でない振る舞いは不具合につながる。 また、コメントでもない限り、意図してそのコードにしているのかも分かりにくい。

PEP20: Zen of Python にある Explicit is better than implicit. を実践するのであれば、真偽値を渡すほうが良いと思う。 例えば、最初のコードで仮に「None か否か」を判定したいのであれば、次のようにした方が良いと考えられる。

>>> def f(x):
...     # オブジェクトが None か判定結果を真偽値として得る
...     if x is not None:
...         print('Valid')
...     else:
...         print('Invalid')
... 

... is not None は対象が None かそうでないかを真偽値で返すことになる。 解釈にブレが生じることはない。

>>> 'Hello, World!' is not None
True
>>> '' is not None
True
>>> 1 is not None
True
>>> 0 is not None
True
>>> None is not None
False

ちなみに、自分で定義したクラスのインスタンスが組み込み関数 bool() に渡されたときの振る舞いはオーバーライドできる。 具体的には特殊メソッド __bool__() を実装すれば良い。

以下のサンプルコードでは、クラス FizzBuzz に特殊メソッドを定義して振る舞いをオーバーライドしている。 このクラスのインスタンスは渡された整数の値によって組み込み関数 bool() から得られる結果を切り替える。

>>> class FizzBuzz(object):
...     """整数が 3 か 5 で割り切れる値か真偽値で確認できるクラス"""
...     def __init__(self, n):
...         self.n = n
...     def __bool__(self):
...         # Fizz
...         if self.n % 3 == 0:
...             return True
...         # Buzz
...         if self.n % 5 == 0:
...             return True
...         # Others
...         return False
... 

引数が 35 で割り切れるときに True を返し、それ以外は False になる。

>>> o = FizzBuzz(3)
>>> bool(o)
True
>>> o = FizzBuzz(5)
>>> bool(o)
True
>>> o = FizzBuzz(4)
>>> bool(o)
False

いじょう。

Python: seaborn を使った可視化を試してみる

今回は、Python の有名な可視化ライブラリである matplotlib のラッパーとして動作する seaborn を試してみる。 seaborn を使うと、よく必要になる割に matplotlib をそのまま使うと面倒なグラフが簡単に描ける。 毎回、使うときに検索することになるので備忘録を兼ねて。

使った環境は次の通り。

$ sw_vers  
ProductName:    Mac OS X
ProductVersion: 10.14.4
BuildVersion:   18E226
$ python -V
Python 3.7.3

もくじ

下準備

下準備として seaborn をインストールしておく。

$ pip install seaborn

今回は Python のインタプリタ上で動作確認する。

$ python

まずは seaborn と matplotlib をインポートする。

>>> import seaborn as sns
>>> from matplotlib import pyplot as plt

グラフが見やすいようにスタイルを設定する。

>>> sns.set(style='darkgrid')

Relational plots

まずは seaborn の中で「Relational plots」というカテゴリに属するグラフから試していく。

scatter plot (散布図)

まずは散布図から。

動作確認のために "tips" という名前のデータセットを読み込む。 これは、レストランでの支払いに関するデータセットになっている。

>>> tips = sns.load_dataset('tips')
>>> type(tips)
<class 'pandas.core.frame.DataFrame'>
>>> tips.head()
   total_bill   tip     sex smoker  day    time  size
0       16.99  1.01  Female     No  Sun  Dinner     2
1       10.34  1.66    Male     No  Sun  Dinner     3
2       21.01  3.50    Male     No  Sun  Dinner     3
3       23.68  3.31    Male     No  Sun  Dinner     2
4       24.59  3.61  Female     No  Sun  Dinner     4

散布図を描くときは scatterplot() という関数を使う。

>>> sns.scatterplot(data=tips, x='total_bill', y='tip')
<matplotlib.axes._subplots.AxesSubplot object at 0x1166db390>

関数を呼び出したら pyplot.show() 関数を実行しよう。 なお、以降は plt.show() の実行については省略する。

>>> plt.show()

すると、次のようなグラフが得られる。
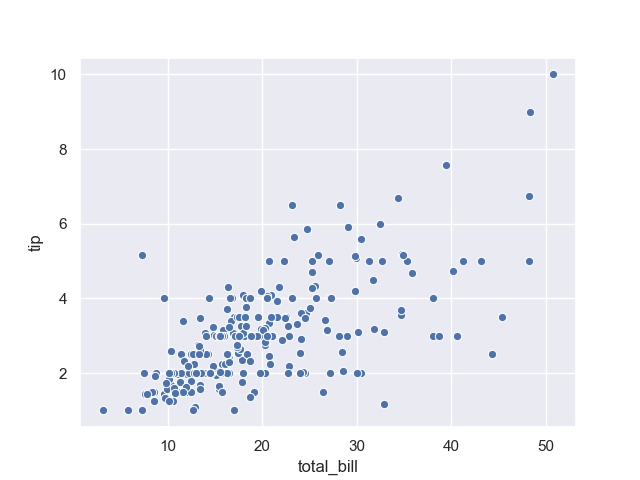
f:id:momijiame:20190429173201p:plain

上記では、支払い総額とチップの関係性を散布図で可視化している。 それなりに相関がありそうだ。

続いては、喫煙者と非喫煙者で傾向に差があるかどうか見てみよう。 一つのグラフの中で見比べるときは hue オプションを使うと良い。

>>> sns.scatterplot(data=tips, x='total_bill', y='tip', hue='smoker')
<matplotlib.axes._subplots.AxesSubplot object at 0x11e1949b0>

以下のようなグラフが得られる。
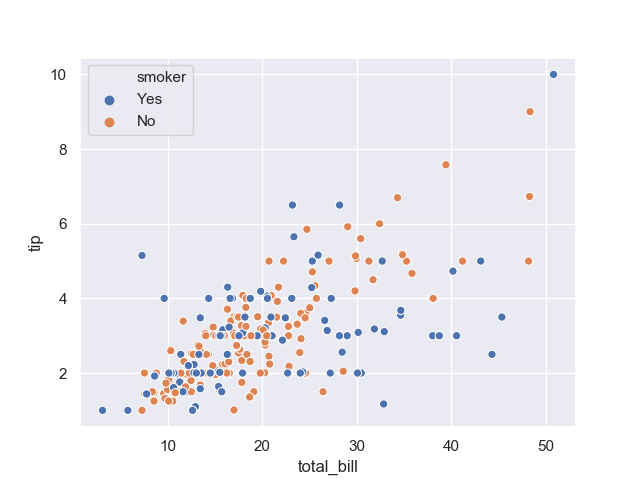
f:id:momijiame:20190429173328p:plain

hue オプション以外にも、一つのグラフの中で違うことを示すには stylesize といったオプションも使える。

例えば style を指定してみよう。

>>> sns.scatterplot(data=tips, x='total_bill', y='tip', style='smoker')
<matplotlib.axes._subplots.AxesSubplot object at 0x11c43e588>

すると、次のようにマーカーの形が変わる。
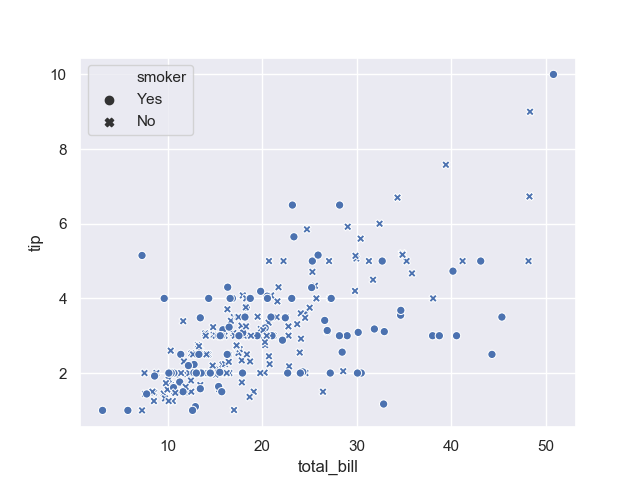
f:id:momijiame:20190429174820p:plain

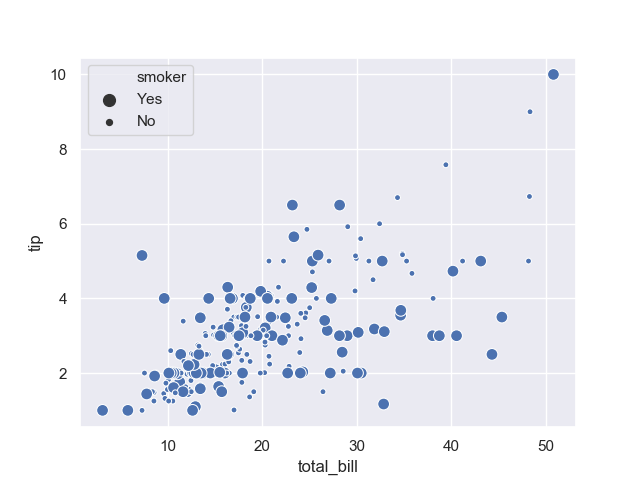
同様に size を指定してみる。

>>> sns.scatterplot(data=tips, x='total_bill', y='tip', size='smoker')
<matplotlib.axes._subplots.AxesSubplot object at 0x11c4a2908>

すると、次のようにマーカーの大きさが変わる。
f:id:momijiame:20190429175000p:plain

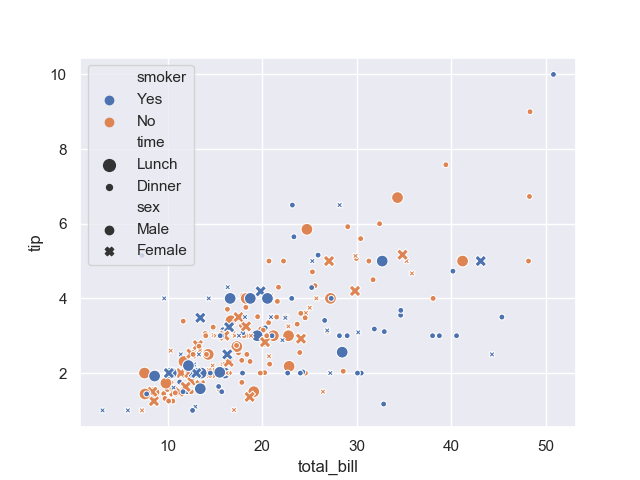
もちろん、これらのオプションは混ぜて使うこともできる。 例えば喫煙者か非喫煙者か以外に、性別や時間 (ランチ・ディナー) について指定してみよう。

>>> sns.scatterplot(data=tips, x='total_bill', y='tip', hue='smoker', style='sex', size='time')
<matplotlib.axes._subplots.AxesSubplot object at 0x11da1a400>

次のようなグラフが得られる。
f:id:momijiame:20190429175211p:plain

うん、まったく訳がわからない。 一つのグラフには情報を詰め込みすぎないように気をつけよう。 なお、ここまで使ってきた huestylesize といったオプションは別の API でも使える場合が多い。

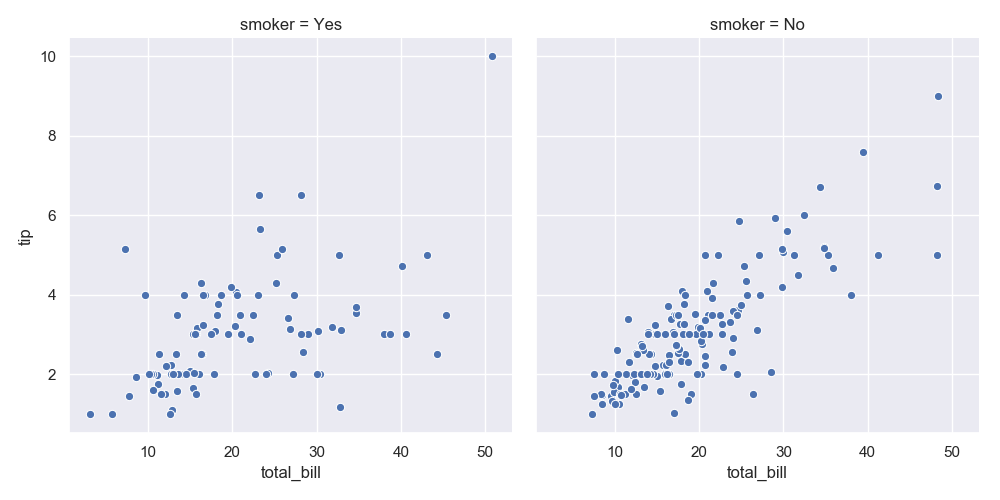
また、relplot() 関数を使うと複数の散布図を扱うことができる。 relplot() 関数は scatterplot() 関数を、より一般化した API となっている。 散布図は kind='scatter' と指定することで扱える。 同時に col オプションを指定すると、そこに指定したカラムごとに別々のグラフが得られる。

>>> sns.relplot(data=tips, kind='scatter', x='total_bill', y='tip', col='smoker')
<seaborn.axisgrid.FacetGrid object at 0x102e0b0f0>

上記で得られるグラフが以下。 喫煙者は支払総額とチップの相関が非喫煙者に比べるとやや低いように見受けられる。
f:id:momijiame:20190429183315p:plain

実際に確認してみよう。

>>> tips.corr()['total_bill']['tip']
0.6757341092113642
>>> tips[tips.smoker == 'No'].corr()['total_bill']['tip']
0.822182625705083
>>> tips[tips.smoker == 'Yes'].corr()['total_bill']['tip']
0.4882179411628103

全体では相関係数が 0.675 だったのに対して非喫煙者で層化すると 0.822 となり喫煙者では 0.488 となった。

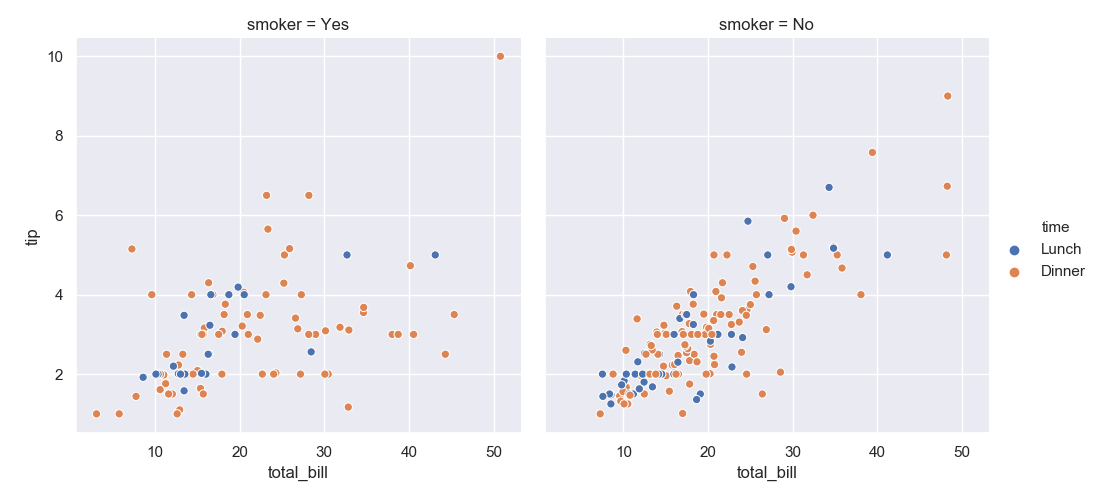
複数のグラフに分割すると、情報を詰め込みすぎて見にくいグラフになることを防げる。 試しに colhue を併用してみよう。

>>> sns.relplot(data=tips, kind='scatter', x='total_bill', y='tip', hue='time', col='smoker')
<seaborn.axisgrid.FacetGrid object at 0x11e5ee470>

以下のグラフでは喫煙者・非喫煙者でグラフを分けつつ、各グラフの中では時間によるチップ額の傾向を分けて示している。
f:id:momijiame:20190429184110p:plain

line plot (折れ線グラフ)

続いては折れ線グラフを試す。

動作確認のために "flights" というデータセットを読み込もう。 これは、飛行機の乗客数の推移を示している。

>>> flights = sns.load_dataset('flights')
>>> flights.head()
   year     month  passengers
0  1949   January         112
1  1949  February         118
2  1949     March         132
3  1949     April         129
4  1949       May         121

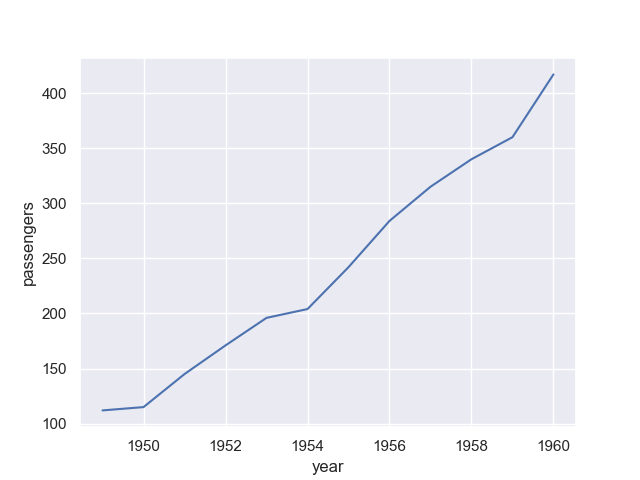
試しに 1 月の乗客の推移を年ごとに可視化してみよう。 折れ線グラフの描画には lineplot() 関数を使う。

>>> sns.lineplot(data=flights[flights.month == 'January'], x='year', y='passengers')
<matplotlib.axes._subplots.AxesSubplot object at 0x11c6c6b00>

上記から得られるグラフは次の通り。 乗客の数は右肩上がりのようだ。
f:id:momijiame:20190429184551p:plain

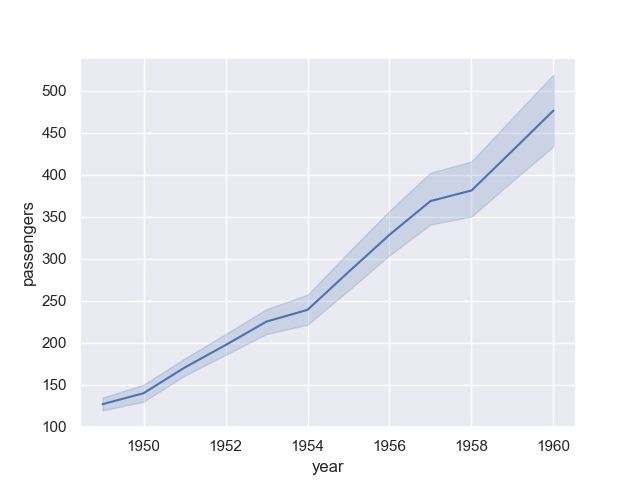
特定の月に限定しない場合についても確認しておこう。

>>> sns.lineplot(data=flights, x='year', y='passengers')
<matplotlib.axes._subplots.AxesSubplot object at 0x11e659940>

上記から得られたグラフが次の通り。 今度は実線の上下に範囲を指定するようなグラフになった。 これはデフォルトではブートストラップ信頼区間 (信頼係数 95%)を示しているらしい。
f:id:momijiame:20190429184751p:plain

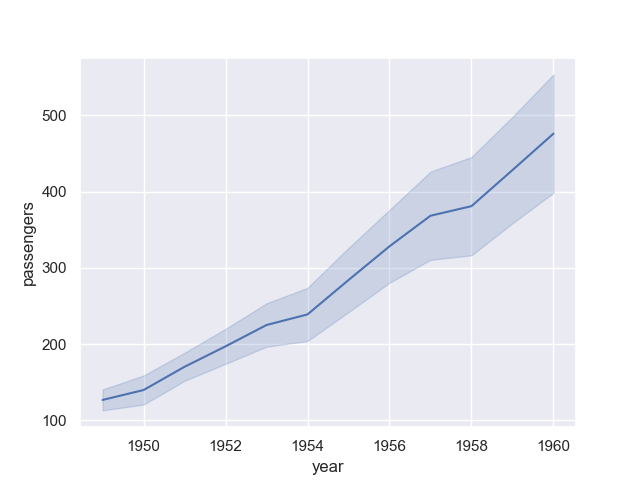
ci オプションに sd を指定することで、標準偏差を用いた信頼区間にもできるようだ。 使うのは、分散が正規分布と仮定できる場合?

>>> sns.lineplot(data=flights, x='year', y='passengers', ci='sd')
<matplotlib.axes._subplots.AxesSubplot object at 0x11e69bb00>
f:id:momijiame:20190429185132p:plain

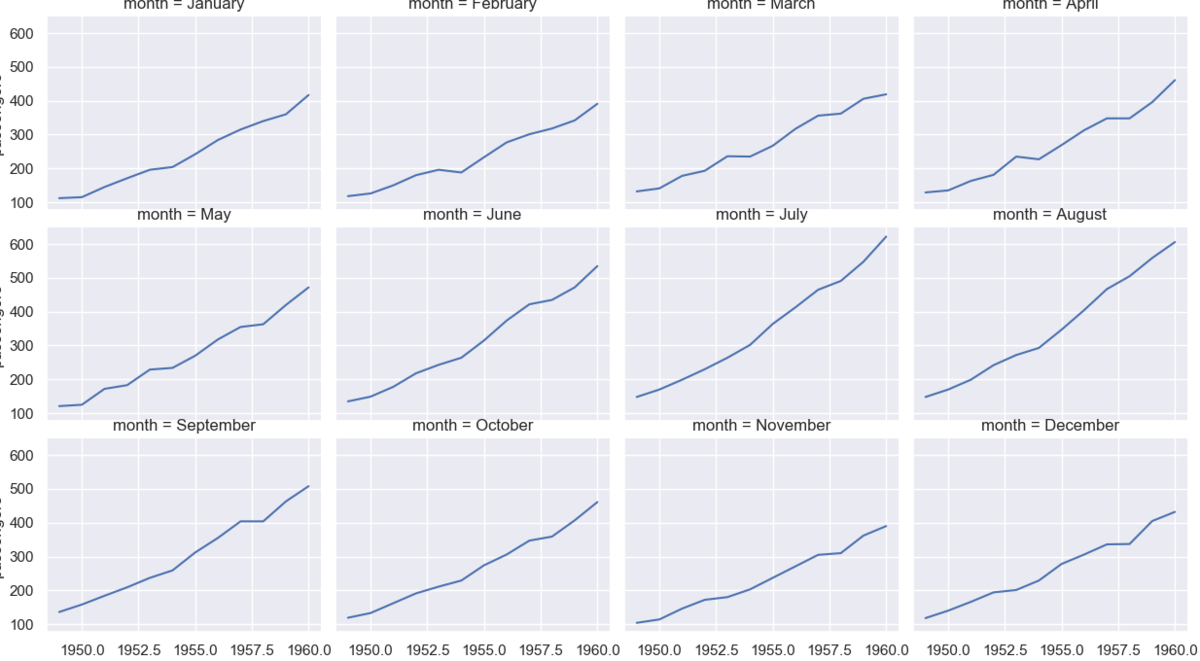
複数のグラフに分けて表示したいときは scatterplot() のときと同じように relplot() を使う。 ただし、kind には line を指定する。 また、数が多いときは横に並んでしまうので col_wrap を指定することで折り返すと良い。

>>> sns.relplot(data=flights, kind='line', x='year', y='passengers', col='month', col_wrap=4)
<seaborn.axisgrid.FacetGrid object at 0x11e631898>
f:id:momijiame:20190429191750p:plain

Categorical plots

続いては "Categorical plots" に分類されるグラフを見ていく。

動作確認のために "titanic" データセットを読み込む。 タイタニック号の沈没に関する乗客のデータセット。

>>> titanic = sns.load_dataset('titanic')
>>> titanic.head()
   survived  pclass     sex   age  sibsp  parch  ...    who adult_male deck  embark_town  alive  alone
0         0       3    male  22.0      1      0  ...    man       True  NaN  Southampton     no  False
1         1       1  female  38.0      1      0  ...  woman      False    C    Cherbourg    yes  False
2         1       3  female  26.0      0      0  ...  woman      False  NaN  Southampton    yes   True
3         1       1  female  35.0      1      0  ...  woman      False    C  Southampton    yes  False
4         0       3    male  35.0      0      0  ...    man       True  NaN  Southampton     no   True

[5 rows x 15 columns]

strip plot (ストリップチャート)

まずはストリップチャートから。

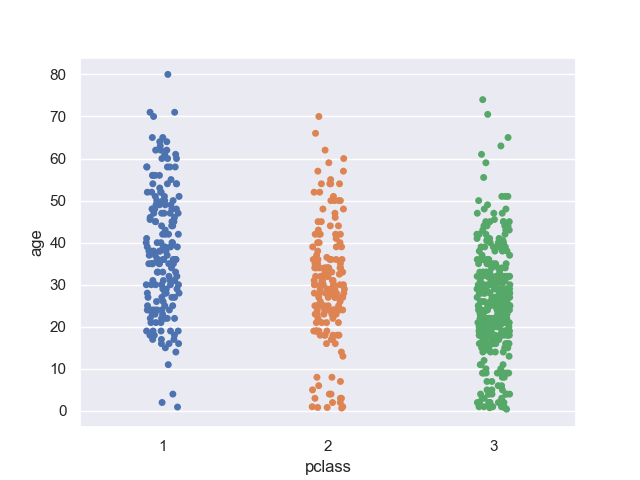
客室のグレードと年齢の関係性についてプロットしてみよう。

>>> sns.stripplot(data=titanic, x='pclass', y='age')
<matplotlib.axes._subplots.AxesSubplot object at 0x11d434748>
f:id:momijiame:20190429193619p:plain

客室のグレードが高い方が年齢層が高め。

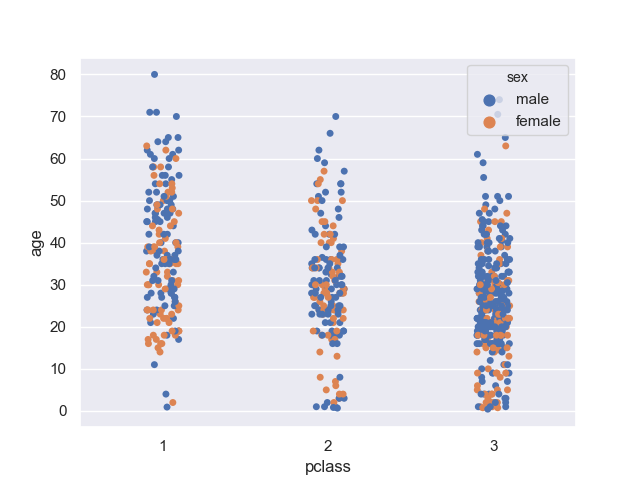
性別で層化してみる。

>>> sns.stripplot(data=titanic, x='pclass', y='age', hue='sex')
<matplotlib.axes._subplots.AxesSubplot object at 0x11d58d6d8>
f:id:momijiame:20190429195744p:plain

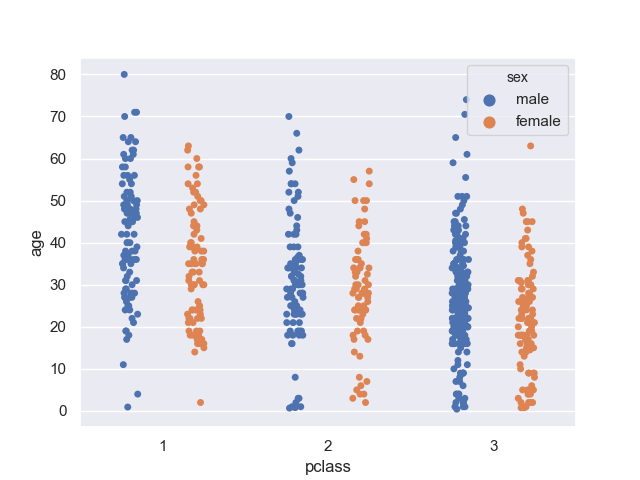
混ざってしまって見にくいときは dodge オプションを True にすると良い。

>>> sns.stripplot(data=titanic, x='pclass', y='age', hue='sex', dodge=True)
<matplotlib.axes._subplots.AxesSubplot object at 0x11d48ca20>
f:id:momijiame:20190429195854p:plain

女性の方が、やや年齢層が低そう? 家族など、男性と一緒に来ている影響もあるだろうか。

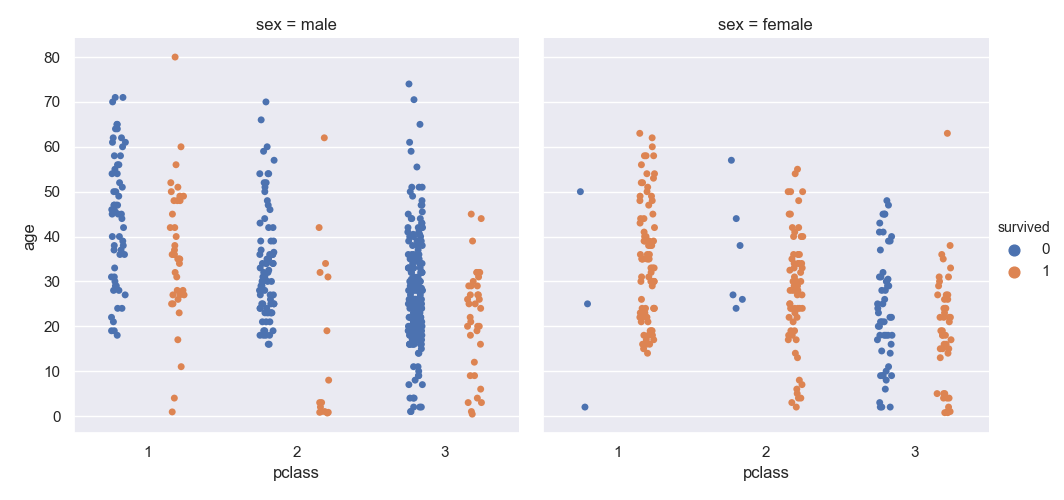
生死で層化した場合についても見てみよう。 複数のグラフに分けたいときは catplot() 関数を使う。 その際、kind オプションには strip を指定する。 これは scatterplot()lineplot() で複数のグラフを扱うときに relplot() を使ったのと同じ考え方。

>>> sns.catplot(data=titanic, kind='strip', x='pclass', y='age', hue='survived', col='sex', dodge=True)
<seaborn.axisgrid.FacetGrid object at 0x11d47a4a8>
f:id:momijiame:20190429200224p:plain

あきらかに、一等客室と二等客室の女性は生き残りやすかったことが分かる。

swarm plot (スウォームチャート)

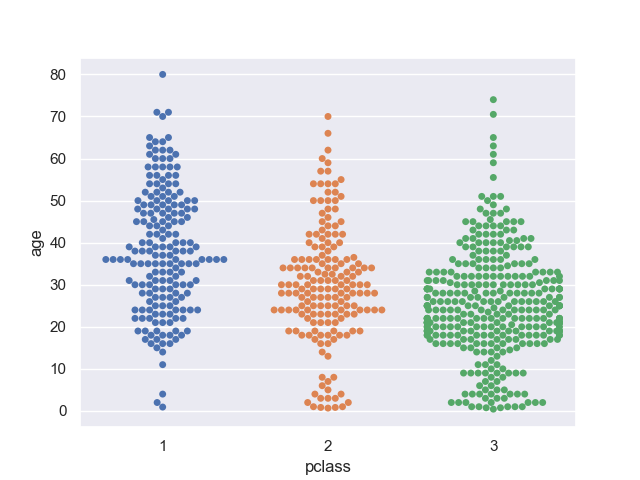
ストリップチャートは要素が重なっていたけど、重なりを除外したものがこちら。 swarmplot() 関数を使うことで描画できる。

>>> sns.swarmplot(data=titanic, x='pclass', y='age')
<matplotlib.axes._subplots.AxesSubplot object at 0x11daa6320>
f:id:momijiame:20190430132145p:plain

似たような値の数がどれくらいあるかは分かりやすいかも。

box plot (箱ひげ図)

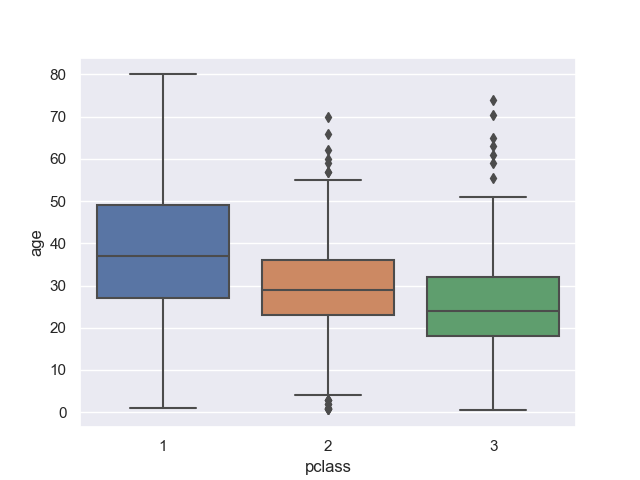
これは多くの人に馴染みがあると思う。 箱ひげ図は boxplot() 関数を使って描画する。

>>> sns.boxplot(data=titanic, x='pclass', y='age')
<matplotlib.axes._subplots.AxesSubplot object at 0x11d5bc7b8>
f:id:momijiame:20190430132250p:plain

最大値、第二四分位数、中央値、第三四分位数、最小値、外れ値を確認できる。 外れ値は第二、第三四分位数から 1.5 IQR (Interquartile Range) の外にあるものになる。

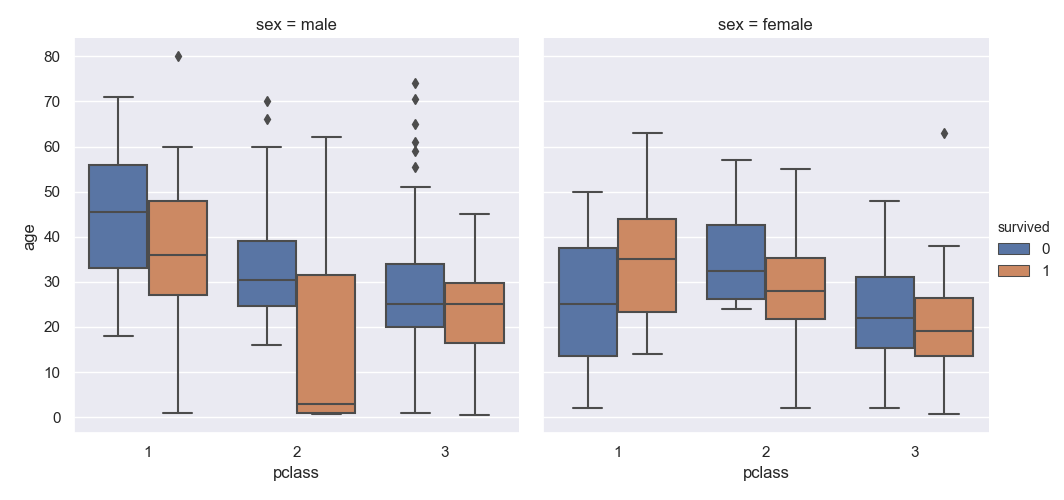
複数のグラフに分けて表示したいときは catplot() を使いつつ kind オプションに box を指定する。

>>> sns.catplot(data=titanic, kind='box', x='pclass', y='age', hue='survived', col='sex')
<seaborn.axisgrid.FacetGrid object at 0x11da78588>
f:id:momijiame:20190430132736p:plain

ストリップチャートやスウォームチャートに比べると、ざっくり内容を把握するには良い反面、個々の要素は細かく見ることができない。

violin plot (バイオリン図)

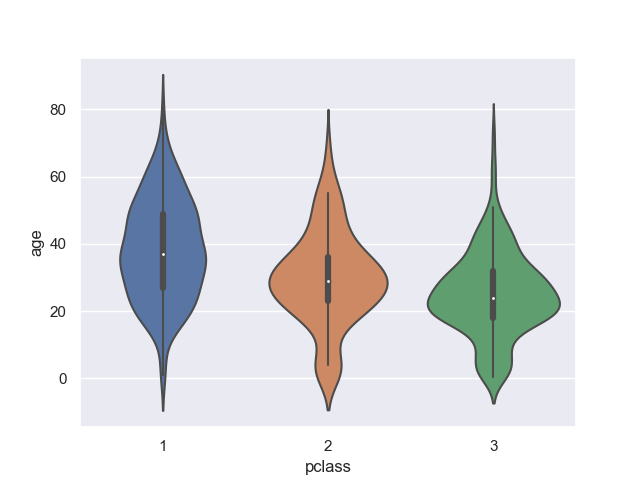
続いては箱ひげ図とスウォームチャートの中間みたいなバイオリン図。 バイオリン図は violinplot() を使って描く。

>>> sns.violinplot(data=titanic, x='pclass', y='age')
<matplotlib.axes._subplots.AxesSubplot object at 0x11d70ebe0>
f:id:momijiame:20190430133302p:plain

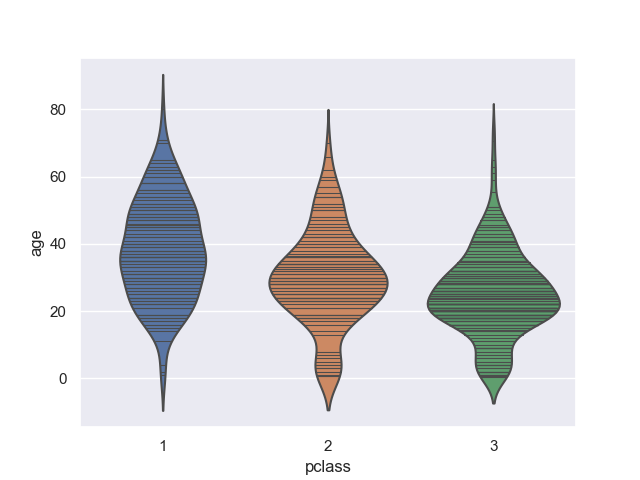
バイオリンの内側については描き方がいくつか考えられる。 例えば inner オプションに stick を指定すると、以下のように個々の要素がどこにあるか示される。

>>> sns.violinplot(data=titanic, x='pclass', y='age', inner='stick')
<matplotlib.axes._subplots.AxesSubplot object at 0x11e572f60>
f:id:momijiame:20190430133839p:plain

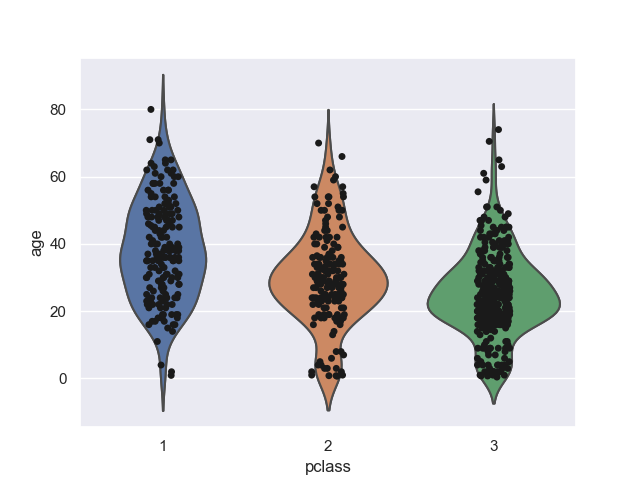
あるいは、次のようにしてグラフを重ね合わせて自分で描いても良い。

>>> ax = sns.violinplot(data=titanic, x='pclass', y='age', inner=None)
>>> sns.stripplot(data=titanic, x='pclass', y='age', color='k', ax=ax)
<matplotlib.axes._subplots.AxesSubplot object at 0x11ec321d0>
f:id:momijiame:20190430133848p:plain

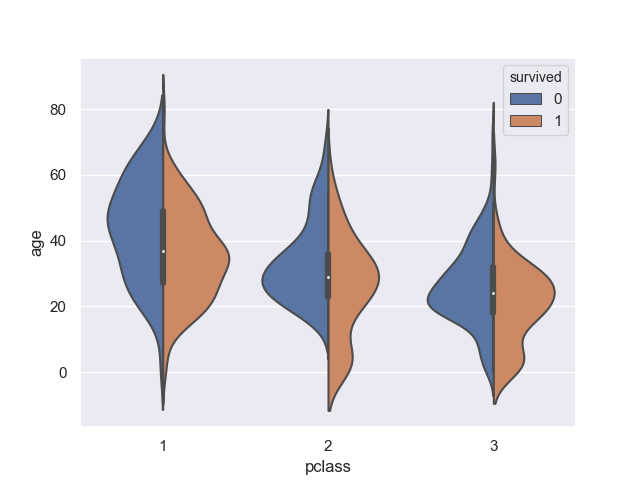
層化させたときの表示方法も複数ある。 hue オプション以外、特に何も指定しなければ次のようになる。 箱ひげ図などと同じ感じ。

>>> sns.violinplot(data=titanic, x='pclass', y='age', hue='survived')
<matplotlib.axes._subplots.AxesSubplot object at 0x11d7e6780>

ここで、同時に split オプションに True を指定すると、次のように左右で表示が変わる。

>>> sns.violinplot(data=titanic, x='pclass', y='age', hue='survived', split=True)
<matplotlib.axes._subplots.AxesSubplot object at 0x11e94eb38>
f:id:momijiame:20190430133958p:plain

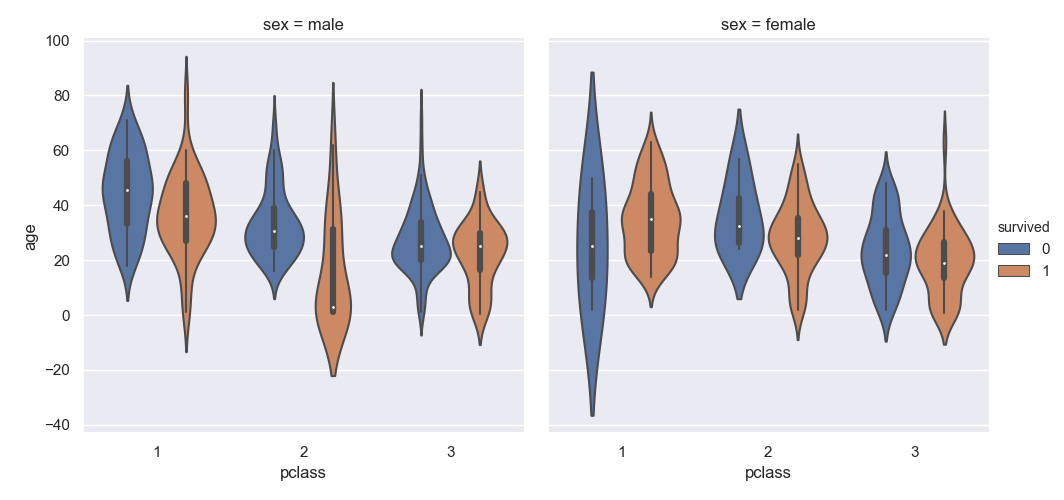
複数のグラフに分けるときは、これまでと同じように catplot() を指定する。 kind オプションには violin を指定する。

>>> sns.catplot(data=titanic, kind='violin', x='pclass', y='age', hue='survived', col='sex')
<seaborn.axisgrid.FacetGrid object at 0x11e127198>
f:id:momijiame:20190430135017p:plain

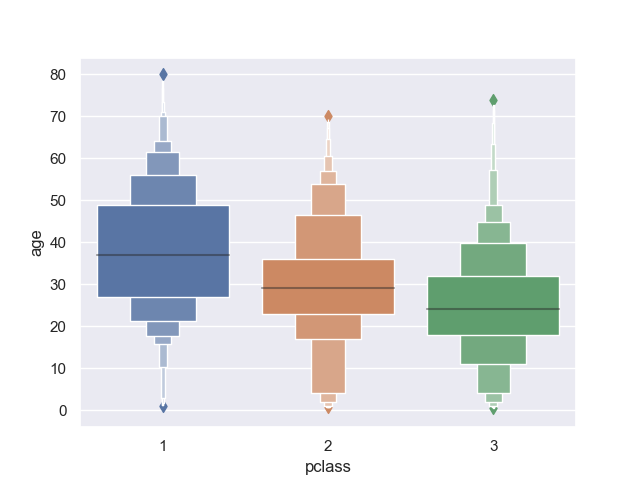
boxen plot (a.k.a letter value plot)

日本語の対応が不明なんだけど、箱ひげ図を改良したグラフ。 一般的には "letter value plot" と呼ばれているみたい。

seaborn では boxenplot() 関数を使って描く。

>>> sns.boxenplot(data=titanic, x='pclass', y='age')
<matplotlib.axes._subplots.AxesSubplot object at 0x10cb33710>
f:id:momijiame:20190430141614p:plain

箱ひげ図よりも分布に関する情報の落ち方が少ないのがポイントらしい。

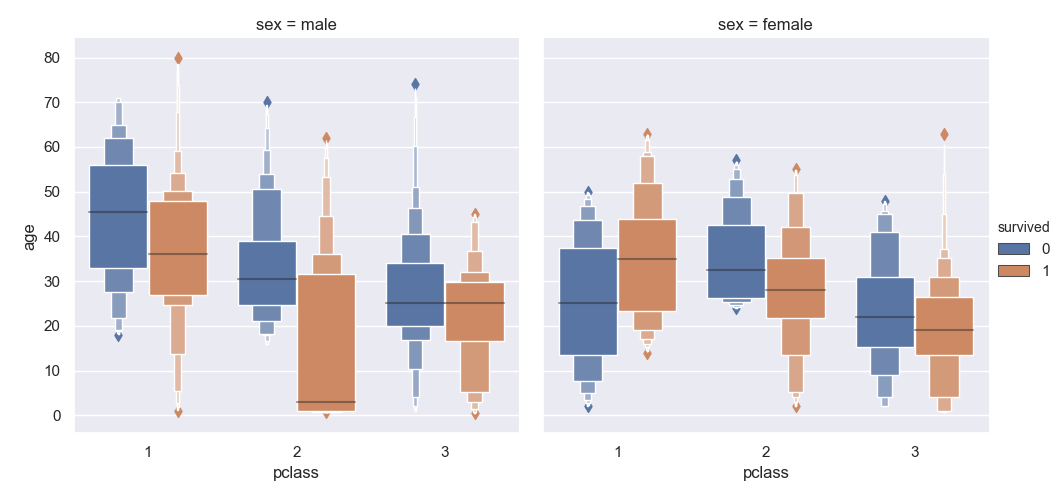
複数のグラフに分けるときは catplot() 関数で kind に boxen を指定する。

>>> sns.catplot(data=titanic, kind='boxen', x='pclass', y='age', hue='survived', col='sex')
<seaborn.axisgrid.FacetGrid object at 0x11e0a2d68>
f:id:momijiame:20190430142720p:plain

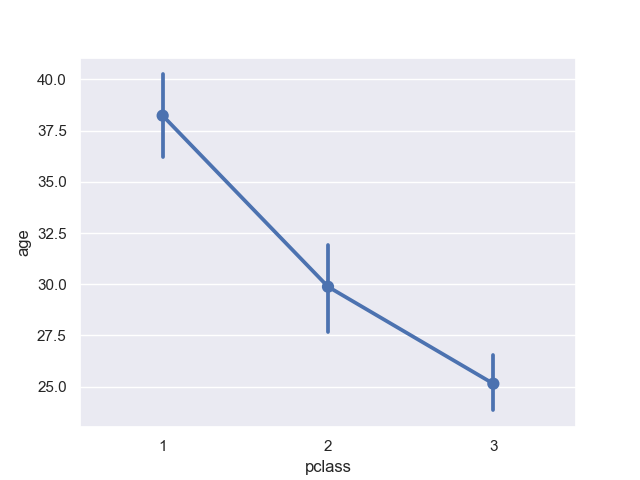
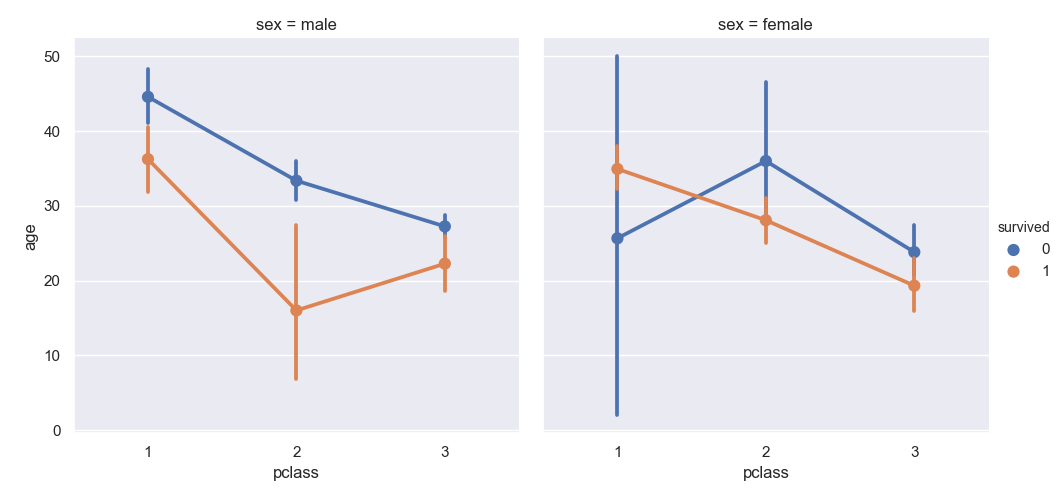
point plot

こちらも日本語の対応が分からない。 平均値と信頼区間だけの表示に絞られたシンプルなグラフ。

>>> sns.pointplot(data=titanic, x='pclass', y='age')
<matplotlib.axes._subplots.AxesSubplot object at 0x11d459d30>
f:id:momijiame:20190430141847p:plain

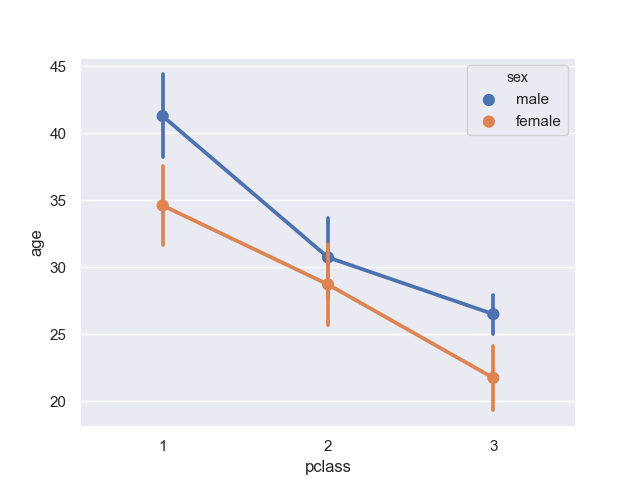
シンプルがゆえに、層化すると統計的に有意か否かを示しやすいかも。 そういえば効果を示すときにこんなグラフ使ってるの見たことあるな。

>>> sns.pointplot(data=titanic, x='pclass', y='age', hue='sex')
<matplotlib.axes._subplots.AxesSubplot object at 0x11d4b2278>
f:id:momijiame:20190430141951p:plain

複数のグラフに分けるときは catplot() 関数で kind に point を指定する。

>>> sns.catplot(data=titanic, kind='point', x='pclass', y='age', hue='survived', col='sex')
<seaborn.axisgrid.FacetGrid object at 0x11d456080>
f:id:momijiame:20190430142623p:plain

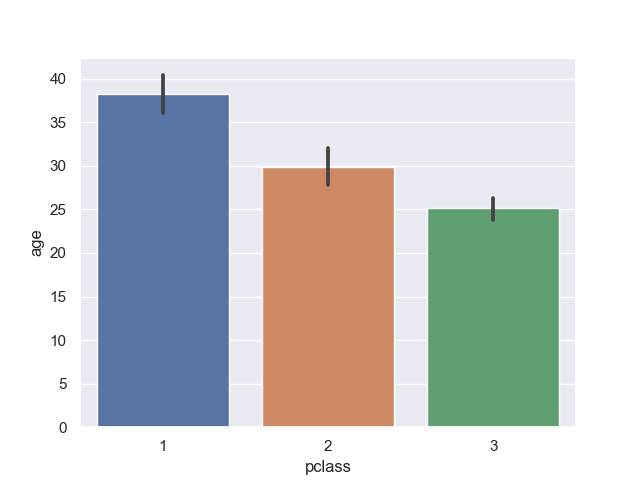
barplot (棒グラフ)

馴染みのある棒グラフ。

>>> sns.barplot(data=titanic, x='pclass', y='age')
<matplotlib.axes._subplots.AxesSubplot object at 0x11e65d080>
f:id:momijiame:20190430142406p:plain

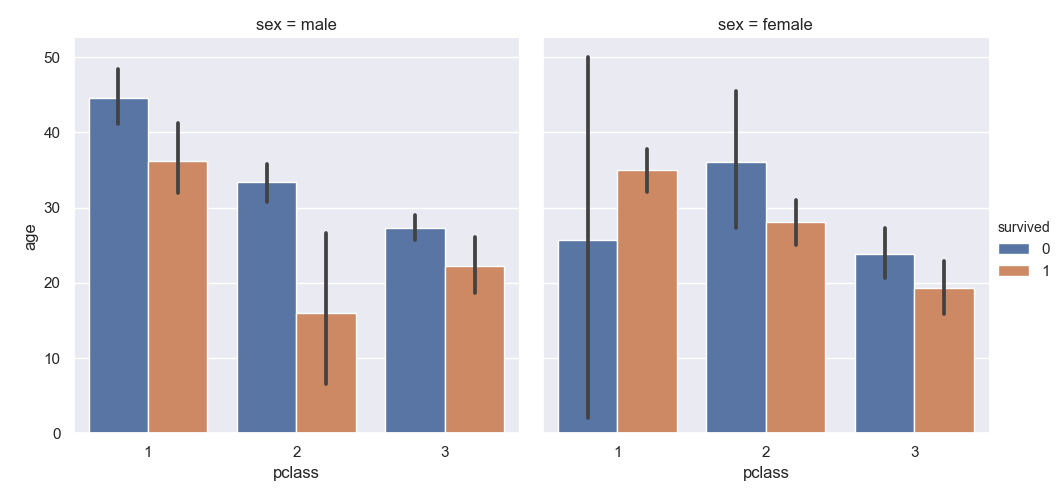
ひげはブートストラップ信頼区間を示している。

複数のグラフに分けるときは catplot() 関数で kind に bar を指定する。

>>> sns.catplot(data=titanic, kind='bar', x='pclass', y='age', hue='survived', col='sex')
<seaborn.axisgrid.FacetGrid object at 0x11d6eaac8>
f:id:momijiame:20190430142513p:plain

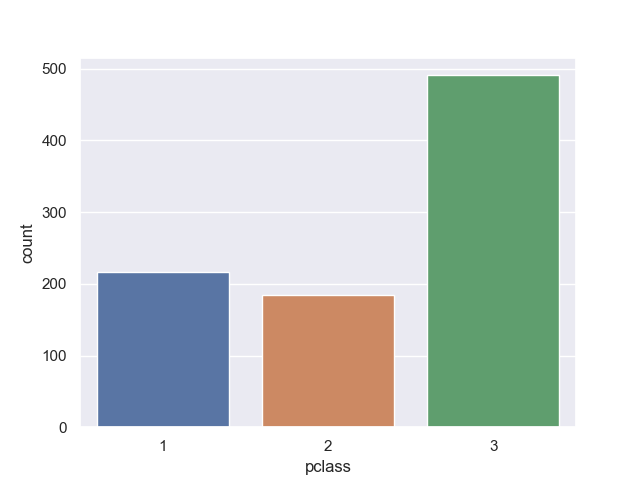
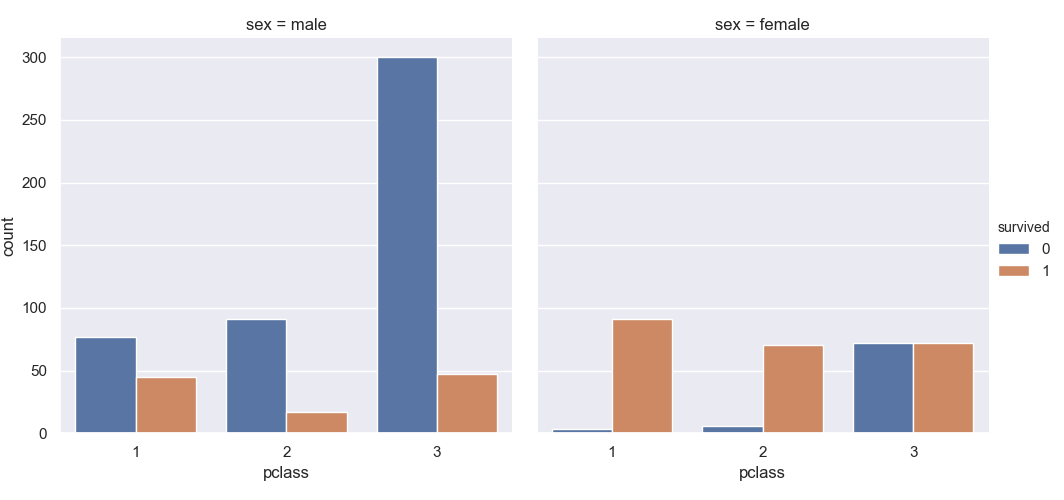
count plot

同じ棒グラフでも値のカウントに特価したのが、この countplot() 関数。 使うときは x 軸か y 軸の一軸だけを指定する。

>>> sns.countplot(data=titanic, x='pclass')
<matplotlib.axes._subplots.AxesSubplot object at 0x11da03978>
f:id:momijiame:20190430142827p:plain

比率などに焦点を絞って可視化するときに見やすい。

>>> sns.catplot(data=titanic, kind='count', x='pclass', hue='survived', col='sex')
<seaborn.axisgrid.FacetGrid object at 0x11e09a198>
f:id:momijiame:20190430142950p:plain

Distribution plots

続いては "Distribution plots" に分類されるグラフを見ていく。

動作確認用として "iris" データセットを読み込んでおく。

>>> iris = sns.load_dataset('iris')
>>> iris.head()
   sepal_length  sepal_width  petal_length  petal_width species
0           5.1          3.5           1.4          0.2  setosa
1           4.9          3.0           1.4          0.2  setosa
2           4.7          3.2           1.3          0.2  setosa
3           4.6          3.1           1.5          0.2  setosa
4           5.0          3.6           1.4          0.2  setosa

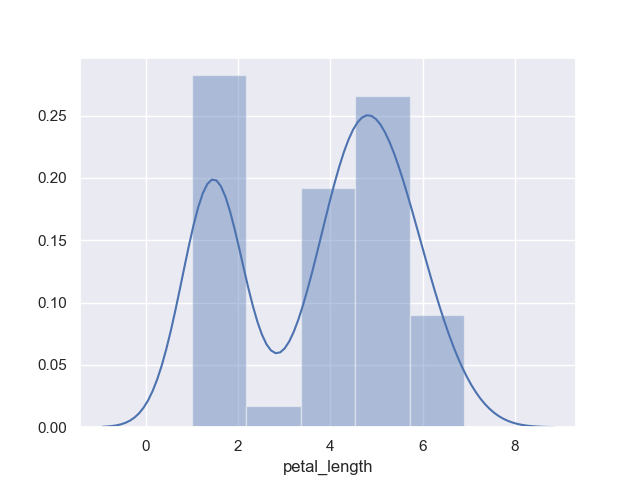
dist plot (ヒストグラム)

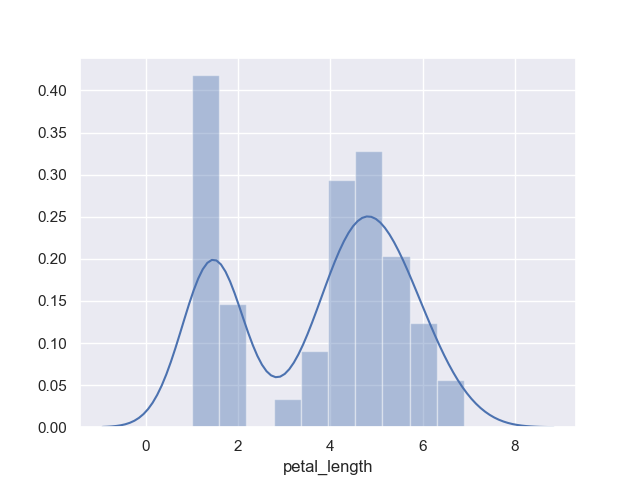
まずは馴染みの深いヒストグラムから。 ヒストグラムは distplot() 関数を使って描画する。

>>> sns.distplot(iris.petal_length)
<matplotlib.axes._subplots.AxesSubplot object at 0x11ee27160>
f:id:momijiame:20190430144346p:plain

階級の数は bins オプションで指定できる。

>>> sns.distplot(iris.petal_length, bins=10)
<matplotlib.axes._subplots.AxesSubplot object at 0x11e0ced68>
f:id:momijiame:20190430144513p:plain

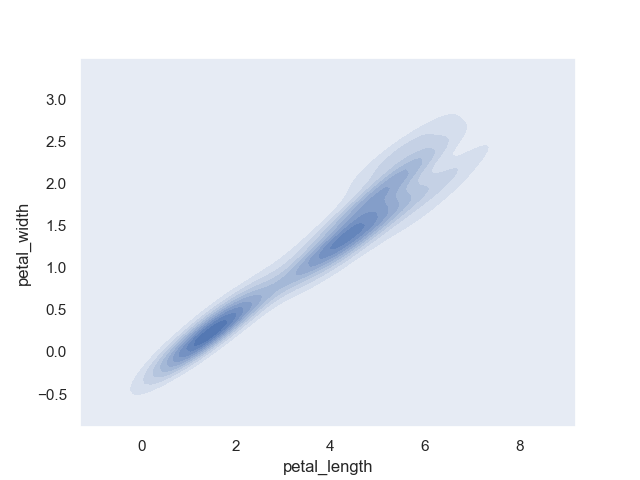
kde plot

KDE (Kernel Density Estimation) はカーネル密度推定という。 分布から確率密度関数を推定するのに用いる。

>>> sns.kdeplot(iris.sepal_length)
<matplotlib.axes._subplots.AxesSubplot object at 0x11d34e160>

二軸で描画することもできる。

>>> sns.kdeplot(iris.petal_length, iris.petal_width, shade=True)
<matplotlib.axes._subplots.AxesSubplot object at 0x11c5832b0>
f:id:momijiame:20190430144735p:plain

rug plot

rug plot は値の登場する位置に特化したグラフ。

>>> sns.rugplot(iris.petal_length)
<matplotlib.axes._subplots.AxesSubplot object at 0x11c701ba8>
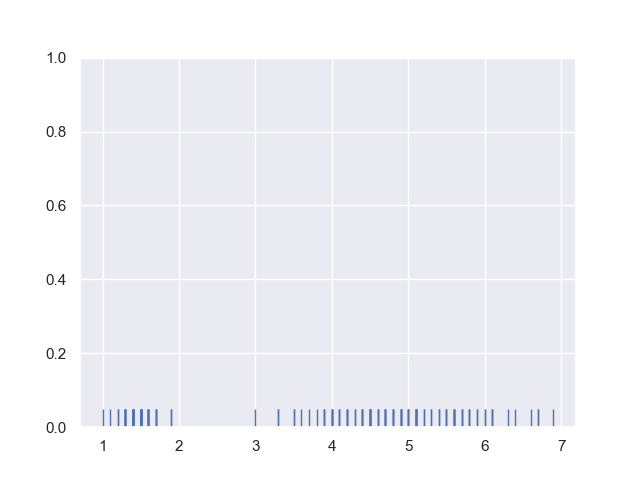
f:id:momijiame:20190430144857p:plain

どちらかというと、他のグラフと重ね合わせて使うものなのかな。

>>> ax = sns.distplot(iris.petal_length)
>>> sns.rugplot(iris.petal_length, ax=ax)
<matplotlib.axes._subplots.AxesSubplot object at 0x11e323c88>
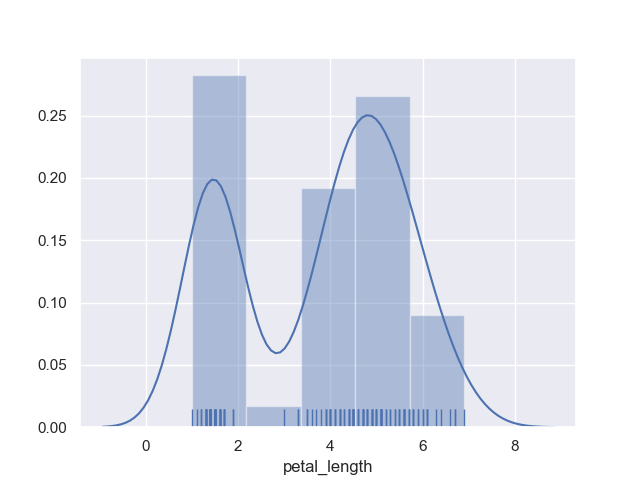
f:id:momijiame:20190430144951p:plain

joint plot

joint plot は二つのグラフの組み合わせ。 デフォルトでは散布図とヒストグラムが同時に見られる。

>>> sns.jointplot(data=iris, x='petal_length', y='petal_width')
<seaborn.axisgrid.JointGrid object at 0x11c6d8320>
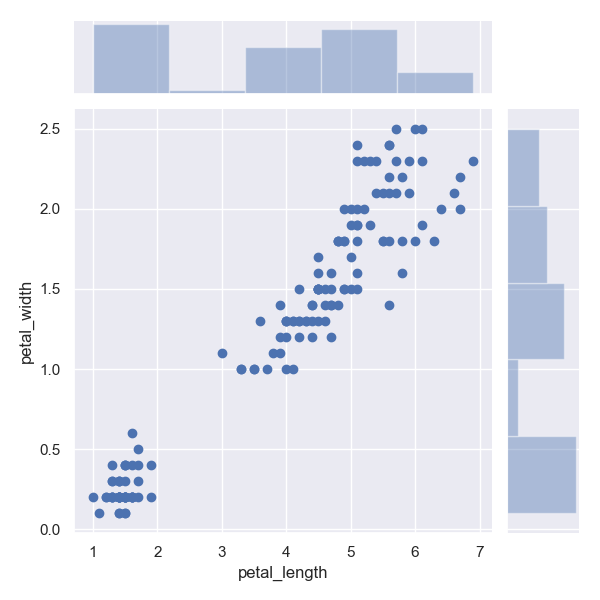
f:id:momijiame:20190430145048p:plain

kindkde を指定すると確率密度関数が見られる。

>>> sns.jointplot(data=iris, x='petal_length', y='petal_width', kind='kde')
<seaborn.axisgrid.JointGrid object at 0x11e6635c0>
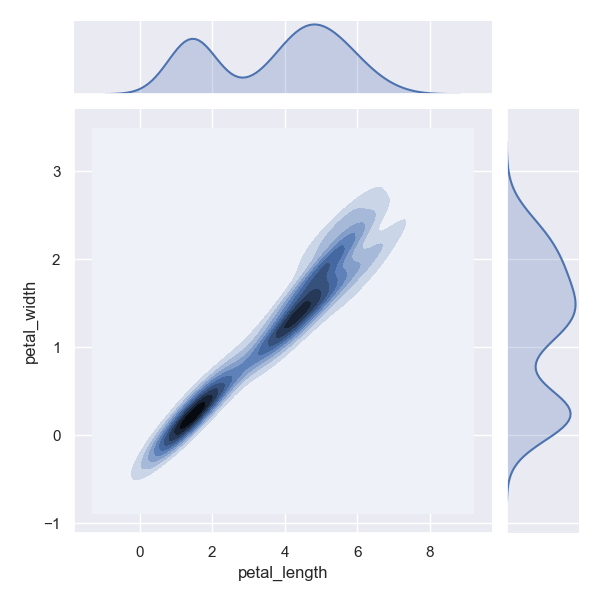
f:id:momijiame:20190430145220p:plain

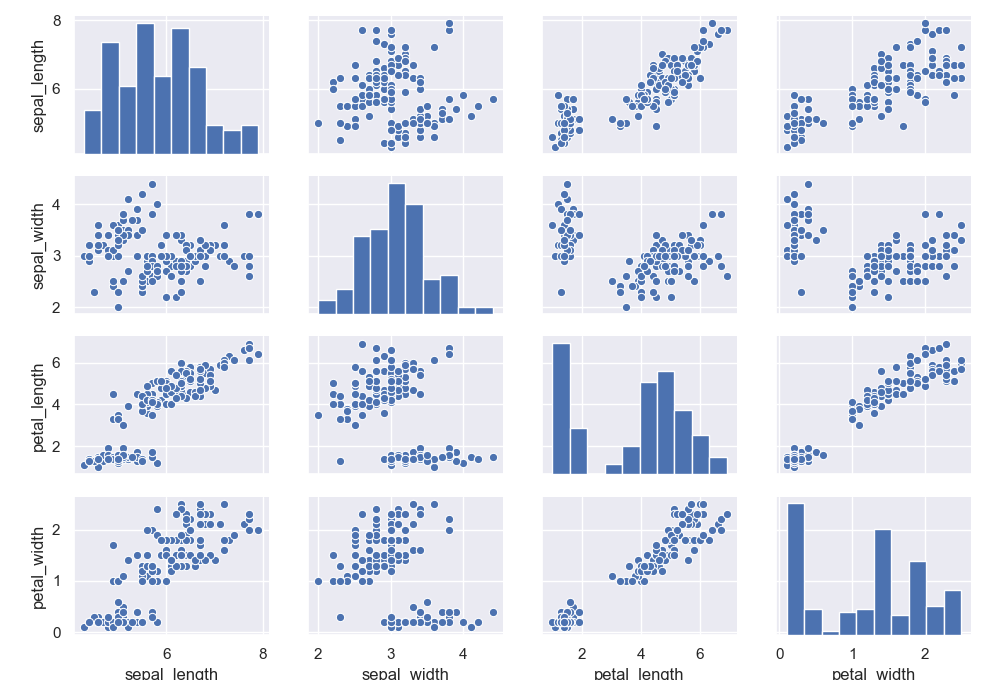
pair plot

pair plot は二軸の組み合わせについて可視化できる。

>>> sns.pairplot(data=iris)
<seaborn.axisgrid.PairGrid object at 0x11e6d6470>
f:id:momijiame:20190430145357p:plain

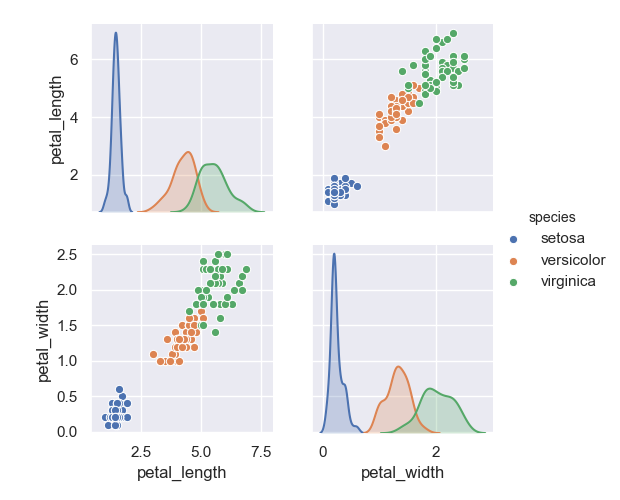
表示する次元を絞るときは vars オプションで指定する。

>>> sns.pairplot(data=iris, hue='species', vars=['petal_length', 'petal_width'])
<seaborn.axisgrid.PairGrid object at 0x11e565390>
f:id:momijiame:20190430145621p:plain

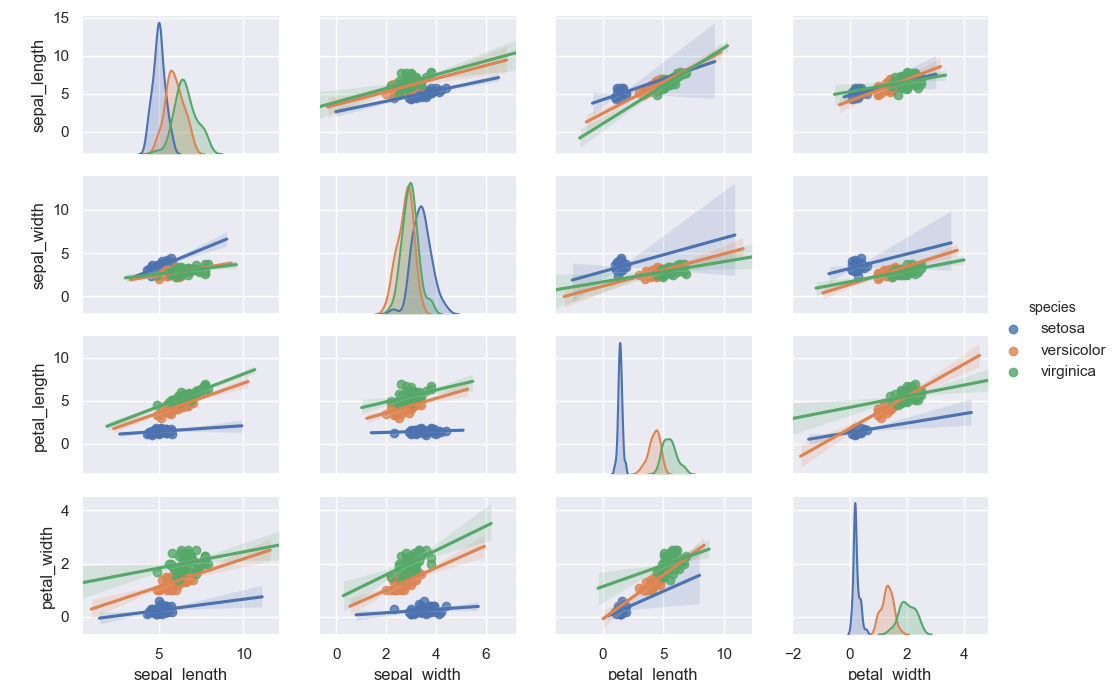
kind オプションに reg を指定すると線形回帰の結果も見られたりする。

>>> sns.pairplot(data=iris, hue='species', kind='reg')
<seaborn.axisgrid.PairGrid object at 0x11db1a668>
f:id:momijiame:20190430145612p:plain

Matrix plots

続いては "Matrix plots" に分類されるグラフを見ていく。

heat map (ヒートマップ)

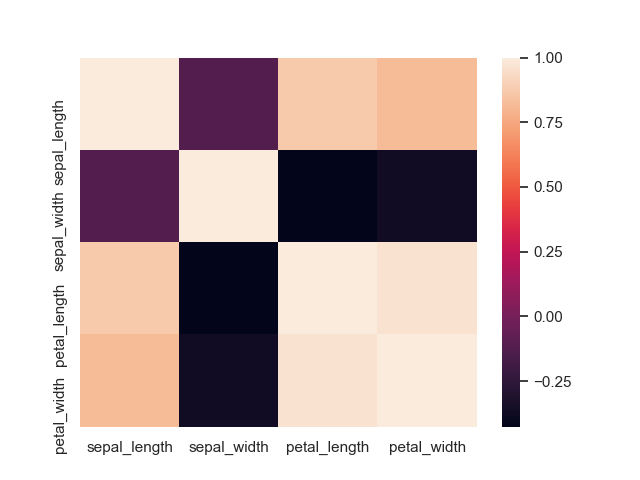
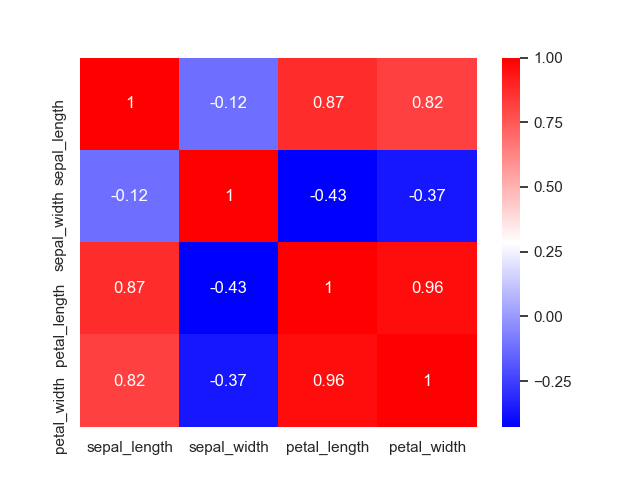
まずはヒートマップから。 相関係数を確認するのに使うことが多いと思う。

>>> sns.heatmap(data=iris.corr())
<matplotlib.axes._subplots.AxesSubplot object at 0x11d8d2048>
f:id:momijiame:20190430145822p:plain

実際の値も一緒に描いたり、カラーマップを変更すると見やすくなる。

>>> sns.heatmap(data=iris.corr(), annot=True, cmap='bwr')
<matplotlib.axes._subplots.AxesSubplot object at 0x11da5cac8>
f:id:momijiame:20190430145916p:plain

まとめ

今回は searborn を使って色々なグラフを描いてみた。 seaborn は多くの API が共通のオプションを備えているため、それらを覚えるだけでなんとなく描けるようになるところが便利。

Python: 文字列を整形する方法について

Python には文字列を整形する方法がいくつかある。 ここでいう整形というのは、定数や変数を元にお目当ての文字列を手に入れるまでの作業を指す。 今回は、それぞれのやり方を紹介しつつメリット・デメリットについて見ていく。

使った環境は次の通り。

$ sw_vers 
ProductName:    Mac OS X
ProductVersion: 10.14.4
BuildVersion:   18E226
$ python -V
Python 3.7.3

+ 演算子 (plus operator)

一番シンプルなのが、この + 演算子を使ったやり方だと思う。 文字列同士を + を使うことで連結できる。

>>> 'Hello, ' + 'World!'
'Hello, World!'

ただ、このやり方は文字列同士でないと使えない。 例えば文字列と整数をプラス演算子で連結しようとすると、以下のような例外になる。

>>> 'Hello, ' + 100
Traceback (most recent call last):
  File "<stdin>", line 1, in <module>
TypeError: can only concatenate str (not "int") to str

そのため、連結する前には明示的に文字列にキャストする必要がある。

>>> 'Hello, ' + str(100)
'Hello, 100'

また、このやり方は上述の問題と併せて、長い文字列を作ろうとしたときにコードが煩雑になりがち。 一つか二つの要素の連結でなければ、別のやり方を検討した方が良いと思う。

% 演算子 (%-formatting)

続いては、以前は主流だった % 演算子を使ったやり方。

これは、書式指定子を埋め込んだ文字列に % 演算子を使って値を埋め込んでいくやり方。

>>> 'Hello, %s' % 'World!'
'Hello, World!'

複数の文字列を埋め込むときは、次のようにタプルで渡す。

>>> '%s, %s' % ('Hello', 'World!')
'Hello, World!'

このやり方の欠点は、タプルの扱いに難があること。 例えば、本当にタプルを渡したいときに次のような例外になる。

>>> t = ('this', 'is', 'a', 'tuple')
>>> '%s' % t
Traceback (most recent call last):
  File "<stdin>", line 1, in <module>
TypeError: not all arguments converted during string formatting

問題を回避するためには、文字列に明示的にキャストしたり、タプルでタプルを包む必要がある。

>>> '%s' % str(t)
"('this', 'is', 'a', 'tuple')"
>>> '%s' % (t, )
"('this', 'is', 'a', 'tuple')"

% 演算子は、過去に利用が推奨されず将来的に削除される予定だった時期もあった (その後、色々あって撤回された)。 なので、以前から Python を積極的に利用している人たちの中では、過去の手法と捉えている人が多いと思う。 個人的にも % 演算子を使っているコードを見ると、やや古めかしいコードという印象を受ける。

string.Template

続いてはちょっと変化球的な string.Template を使うやり方。 これを使っている場面はほとんど見たことがない。 個人的にも、簡易的なテンプレートエンジン代わりに使ったことしかない。

あらかじめ string.Template をインポートする必要がある。 めんどくさいね。

>>> from string import Template

基本的には書式指定子を文字列に埋め込んで使う点は、先ほどの % 演算子を使う場合と同じ。

>>> s = Template('$greet, $message')
>>> s.substitute(greet='Hello', message='World!')
'Hello, World!'

単なる文字列の整形で使う場面はないかな。

str.format()

続いては、現在の主流といえる文字列の format() メソッド。 このやり方は Python 2.6 から導入された。

ここまで見てきたやり方と同じように、文字列に書式指定子を埋め込んで使う。

>>> 'Hello, {}'.format('World!')
'Hello, World!'

% 演算子にあったタプル周りの問題もない。

>>> '{}'.format(t)
"('this', 'is', 'a', 'tuple')"

同じ変数を複数回使いたいときもばっちり。

>>> '{0}, {0}, {1}'.format('Hello', 'World!')
'Hello, Hello, World!'

大抵は、上記のように空のブラケットや数字を使うよりも以下のように明示的に名前をつけると思う。

>>> '{a}, {b}'.format(a='Hello', b='World!')
'Hello, World!'

また、変数の数が多いときは、次のように辞書と組み合わせると可読性の低下を防げると思う。

>>> args = {
...   'a': 'Hello',
...   'b': 'World!'
... }
>>> '{a}, {b}'.format(**args)
'Hello, World!'

後述する f-string が使えない環境では、基本的にはこれを使っておけば良いと思う。

f-string

続いては Python 3.6 から導入された最も新しいやり方である f-string について。

このやり方ではスコープに定義済みの変数をそのまま文字列に埋め込める。

>>> greet, message = 'Hello', 'World!'
>>> f'{greet}, {message}'
'Hello, World!'

f-string には変数だけでなく、式を含めることもできる。

>>> f'1 + 1 = {1 + 1}'
'1 + 1 = 2'

ただ、あまり複雑な式を含めると可読性の低下につながるので注意しよう。

ちなみに f-string の導入前は str.format()locals() を組み合わせた以下のようなハックが知られていた。 locals() はローカルスコープで定義されている全ての変数を辞書で返す組み込み関数。

>>> greet, message = 'Hello', 'World!'
>>> '{greet}, {message}'.format(**locals())
'Hello, World!'

ちょっと乱暴なやり方といえる。

バージョンに制約があることを除けば f-string は使い勝手が良い。

まとめ

  • Python の文字列を整形する方法はいくつかある
  • 現在は str.format() と f-string が主流

参考

methane.hatenablog.jp

www.python.org

Mac で UVC 対応の Web カメラを使ってみる

ちょっとした理由があって、外付けの Web カメラを Mac で使いたくなった。 ただ、大抵の Mac にはインカメラが標準で付いているせいか、別付けの Web カメラを使ってる人があんまりいないみたい。 なので、使えたよって記録を備忘録としてここに書き残しておく。

ちなみに macOS はバージョン 10.4 (Tiger) 以降から UVC (USB Video Class) に対応している。 これは USB でカメラの映像をやり取りするための通信規格で、機器が対応していれば OS 共通のドライバで動かせる。 なので、メーカーが macOS の対応を公式に謳っていなくても、理屈の上では UVC に対応していれば動かせるはず。 今回使ってみたのも UVC 対応の Web カメラで、サンワサプライの CMS-V40BK というモデル。 なお、公式には macOS への対応は謳われていない。

使うときは、特に何をするでもなくカメラから伸びている USB を Mac につなぐだけで認識した。

$ ioreg -p IOUSB
+-o Root  <class IORegistryEntry, id 0x100000100, retain 15>
  +-o AppleUSBXHCI Root Hub Simulation@14000000  <class AppleUSBRootHubDevice, id 0x100005fc6, registered, matched, active, busy 0 (2 ms), retain 15>
    +-o USB Camera@14100000  <class AppleUSBDevice, id 0x100006662, registered, matched, active, busy 0 (22 ms), retain 30>

試しに OpenCV のプログラムを書いてカメラの画像をキャプチャしてみることにした。

#!/usr/bin/env python
# -*- coding: utf-8 -*-

import cv2


def main():
    # カメラの識別子
    CAMERA_ID = 0
    camera = cv2.VideoCapture(CAMERA_ID)

    print('Press space key if you want to save the image')

    while True:
        ret, frame = camera.read()
        if ret is None:
            break

        cv2.imshow('capture', frame)

        key = cv2.waitKey(1) & 0xFF

        if key == 32:
            # スペースキーが押下された場合
            img_name = 'camera_capture.png'
            cv2.imwrite(img_name, frame)
            print('captured')

        if key == ord('q'):
            # Q キーで終了する
            print('bye bye')
            break

    # 後始末
    camera.release()
    cv2.destroyAllWindows()


if __name__ == '__main__':
    main()

動作確認した環境は次の通り。

$ sw_vers
ProductName:    Mac OS X
ProductVersion: 10.14.4
BuildVersion:   18E226
$ python -V                                    
Python 3.7.3
$ python -c "import cv2;print(cv2.__version__)"
4.1.0

撮影した画像は以下。 だいぶ横長になる。 ちなみに、オートフォーカスはついてないみたい。 今回の用途では不要なので気にしなかった。

f:id:momijiame:20190422002027p:plain

いじょう。

f:id:momijiame:20190421204536j:plain:w320

Python: RFE (Recursive Feature Elimination) で特徴量を選択してみる

今回は RFE (Recursive Feature Elimination) と呼ばれる手法を使って特徴量選択 (Feature Selection) してみる。 教師データの中には、モデルの性能に寄与しない特徴量が含まれている場合がある。 アルゴリズムがノイズに対して理想的にロバストであれば、有効な特徴量だけを読み取って学習するため特徴量選択は不要かもしれない。 しかしながら、現実的にはそのような仮定を置くことが難しい場合があると思う。 そこで、元の特徴量からモデルの性能に寄与する部分集合を取り出す作業を特徴量選択という。

特徴量選択の手法には、以下の 3 つがあるようだ。

  • フィルター法 (Filter Method)
    • 統計的な物差しにもとづいて特徴量を評価する
  • ラッパー法 (Wrapper Method)
    • 機械学習のモデルを用いて特徴量を評価する
  • 組み込み法 (Embedding Method)
    • モデルが学習するタイミングで特徴量を評価する

RFE は、上記でいうとラッパー法に分類される。 実際に機械学習のモデルを用いて、部分集合を学習・評価した際に性能が上がるか下がるか確認していく。 フィルター法や組み込み法に比べると必要な計算量は多い。

使った環境は次の通り。

$ sw_vers
ProductName:    Mac OS X
ProductVersion: 10.14.4
BuildVersion:   18E226
$ python -V       
Python 3.7.3

下準備

まずは scikit-learn と matplotlib をインストールしておく。

$ pip install scikit-learn matplotlib

無意味な特徴量が減ることで性能は上がるのか

特徴量を実際に選択してみる前に、そもそも無意味な特徴量を減らすことでモデルの性能は上がるのか確かめておく。

以下のサンプルコードでは二値分類問題のダミーデータを用意している。 データは 100 次元の特徴量を持つものの、実際に意味を持ったものは 5 次元しか含まれていない。 そのデータを使ってランダムフォレストを学習させて 5-Fold CV で AUC (Area Under the Curve) について評価している。 100 次元全てを使った場合と 5 次元だけ使った場合で、どのような差が出るだろうか。

#!/usr/bin/env python
# -*- coding: utf-8 -*-

from sklearn.datasets import make_classification
from sklearn.ensemble import RandomForestClassifier
from sklearn.metrics import roc_auc_score
from sklearn.model_selection import cross_val_predict
from sklearn.model_selection import StratifiedKFold


def main():
    # 疑似的な教師信号を作るためのパラメータ
    args = {
        # 1,000 点のデータ
        'n_samples': 1000,
        # データは 100 次元の特徴量を持つ
        'n_features': 100,
        # その中で意味のあるものは 5 次元
        'n_informative': 5,
        # 重複や繰り返しはなし
        'n_redundant': 0,
        'n_repeated': 0,
        # 二値分類問題
        'n_classes': 2,
        # 生成に用いる乱数
        'random_state': 42,
        # 特徴の順序をシャッフルしない (先頭の次元が informative になる)
        'shuffle': False,
    }
    # 教師信号を作る
    X, y = make_classification(**args)

    # 分類器にランダムフォレストを使う
    clf = RandomForestClassifier(n_estimators=100,
                                 random_state=42)

    # Stratified 5-Fold CV で OOF Prediction (probability) を作る
    skf = StratifiedKFold(n_splits=5,
                          shuffle=True,
                          random_state=42)
    y_pred = cross_val_predict(clf, X, y,
                               cv=skf,
                               method='predict_proba')

    # AUC のスコアを確認する
    metric = roc_auc_score(y, y_pred[:, 1])
    print('All used AUC:', metric)

    # 先頭 5 次元だけを使ったときの AUC スコアを確認する
    y_pred = cross_val_predict(clf, X[:, :5], y,
                               cv=skf,
                               method='predict_proba')
    metric = roc_auc_score(y, y_pred[:, 1])
    print('Ideal AUC:', metric)


if __name__ == '__main__':
    main()

上記の実行結果は次の通り。 全ての特徴量を使った場合の AUC が 0.947 なのに対して、意味を持った特徴量だけを使った場合には 0.981 というスコアが出ている。 あきらかに、意味を持った特徴量だけを使った方が性能が上がっている。

$ python features.py                 
All used AUC: 0.9475844521611112
Ideal AUC: 0.9811272823286553

特徴量の重要度を確認する

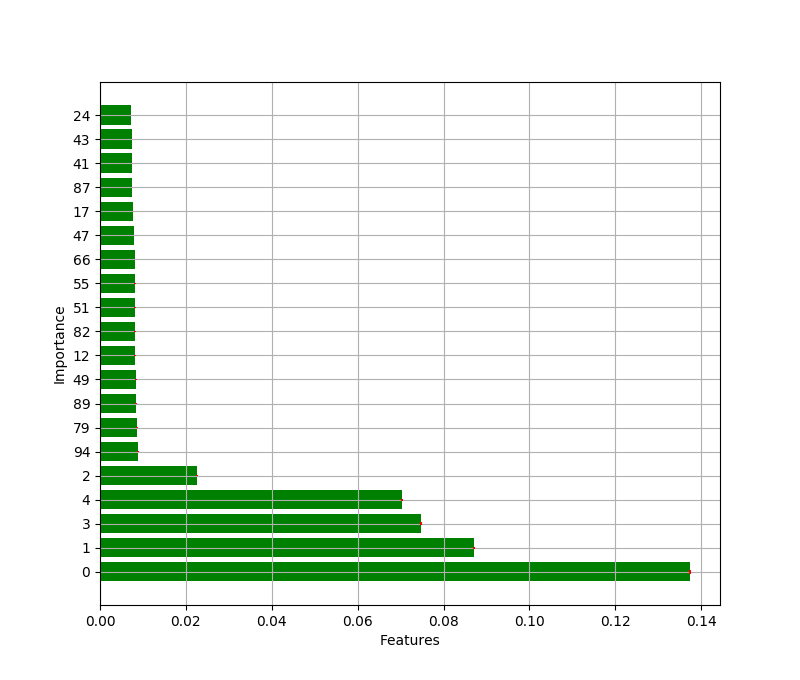
念のため、ランダムフォレストが特徴量の重要度 (Feature Importance) をどのように認識したかを確認しておこう。 以下のサンプルコードでは、全てのデータを使って学習した際の特徴量の重要度を TOP20 で可視化している。 ちなみに、意味のある特徴量は先頭の 5 次元に固まっている。

#!/usr/bin/env python
# -*- coding: utf-8 -*-

import numpy as np
from sklearn.datasets import make_classification
from sklearn.ensemble import RandomForestClassifier
from matplotlib import pyplot as plt


def main():
    args = {
        'n_samples': 1000,
        'n_features': 100,
        'n_informative': 5,
        'n_redundant': 0,
        'n_repeated': 0,
        'n_classes': 2,
        'random_state': 42,
        'shuffle': False,
    }
    X, y = make_classification(**args)

    clf = RandomForestClassifier(n_estimators=100,
                                 random_state=42)

    # 全データを使って学習する
    clf.fit(X, y)

    # ランダムフォレストから特徴量の重要度を取り出す
    importances = clf.feature_importances_
    importance_std = np.std([tree.feature_importances_
                             for tree in clf.estimators_],
                            axis=0)
    indices = np.argsort(importances)[::-1]

    # TOP 20 の特徴量を出力する
    rank_n = min(X.shape[1], 20)
    print('Feature importance ranking (TOP {rank_n})'.format(rank_n=rank_n))
    for i in range(rank_n):
        params = {
            'rank': i + 1,
            'idx': indices[i],
            'importance': importances[indices[i]]
        }
        print('{rank}. feature {idx:02d}: {importance}'.format(**params))

    # TOP 20 の特徴量の重要度を可視化する
    plt.figure(figsize=(8, 32))
    plt.barh(range(rank_n),
             importances[indices][:rank_n],
             color='g',
             ecolor='r',
             yerr=importance_std[indices][:rank_n],
             align='center')
    plt.yticks(range(rank_n), indices[:rank_n])
    plt.xlabel('Features')
    plt.ylabel('Importance')
    plt.grid()
    plt.show()


if __name__ == '__main__':
    main()

上記の実行結果は次の通り。 重要度の上位には、ちゃんと意味もある 5 次元 (00 ~ 04) が選ばれている。 ただ、重要度の桁は違うものの、その他の特徴量にもある程度の重要性を見出してしまっているようだ。

$ python importances.py
Feature importance ranking (TOP 20)
1. feature 00: 0.137486590660634
2. feature 01: 0.08702192608775006
3. feature 03: 0.07472282910658508
4. feature 04: 0.07038842117095266
5. feature 02: 0.02259020059710678
6. feature 94: 0.008822020226963349
7. feature 79: 0.00872048865547228
8. feature 89: 0.008393957575172837
9. feature 49: 0.00833328823498188
10. feature 12: 0.008242356321677316
11. feature 82: 0.008114625429010737
12. feature 51: 0.008104053552752165
13. feature 55: 0.008094847876625212
14. feature 66: 0.008064408438414555
15. feature 47: 0.00785300220608914
16. feature 17: 0.0077133341443931394
17. feature 87: 0.007494065077920688
18. feature 41: 0.007424822763282093
19. feature 43: 0.007354073249384186
20. feature 24: 0.007233824574872333

上記をグラフとして可視化したものは以下の通り。

f:id:momijiame:20190420202654p:plain

このように、モデルがその特徴量を重要と判断しているからといって、本当にそれが性能の向上に寄与するとは限らない。

RFE を使って特徴量を選択する

前置きが長くなったけど、そろそろ実際に RFE で特徴量を選択してみよう。 RFE は scikit-learn に実装がある。

scikit-learn.org

以下のサンプルコードでは RFE とランダムフォレストを使って 100 次元の特徴量から 5 次元を選択している。 また、選択した特徴量の重要度を出力すると共に、選択した特徴量についてホールドアウト検証で性能を確認している。

#!/usr/bin/env python
# -*- coding: utf-8 -*-

from sklearn.datasets import make_classification
from sklearn.ensemble import RandomForestClassifier
from sklearn.feature_selection import RFE
from sklearn.metrics import roc_auc_score
from sklearn.model_selection import train_test_split
from sklearn.model_selection import cross_val_predict
from sklearn.model_selection import StratifiedKFold


def main():
    args = {
        'n_samples': 1000,
        'n_features': 100,
        'n_informative': 5,
        'n_redundant': 0,
        'n_repeated': 0,
        'n_classes': 2,
        'random_state': 42,
        'shuffle': False,
    }
    X, y = make_classification(**args)

    clf = RandomForestClassifier(n_estimators=100,
                                 random_state=42)

    # Recursive Feature Elimination
    rfe = RFE(estimator=clf,
              # 有効そうな 5 つの特徴量を取り出す
              n_features_to_select=5,
              verbose=1)

    # 特徴量の選択と評価のためにデータを分割する
    # 計算量が許すのであれば k-Fold した方が bias は小さくなるはず
    X_train, X_eval, y_train, y_eval = train_test_split(X, y,
                                                        shuffle=True,
                                                        random_state=42)

    # RFE を学習する
    rfe.fit(X_eval, y_eval)

    # RFE による特徴量の評価 (ランキング)
    print('Feature ranking by RFF:', rfe.ranking_)

    # RFE で選択された特徴量だけを取り出す
    X_train_selected = X_train[:, rfe.support_]

    # Stratified 5-Fold CV で OOF Prediction (probability) を作る
    skf = StratifiedKFold(n_splits=5,
                          shuffle=True,
                          random_state=42)
    y_pred = cross_val_predict(clf, X_train_selected, y_train,
                               cv=skf,
                               method='predict_proba')

    # AUC のスコアを確認する
    metric = roc_auc_score(y_train, y_pred[:, 1])
    print('RFE selected features AUC:', metric)


if __name__ == '__main__':
    main()

実行結果は次の通り。 意味がある特徴量である先頭の 5 次元がランキングで 1 位となっている。 どうやら、ちゃんと有効な特徴量が選択できているようだ。

$ python rfe.py 
Fitting estimator with 100 features.
Fitting estimator with 99 features.
Fitting estimator with 98 features.
Fitting estimator with 97 features.
Fitting estimator with 96 features.
Fitting estimator with 95 features.
...(snip)...
Fitting estimator with 10 features.
Fitting estimator with 9 features.
Fitting estimator with 8 features.
Fitting estimator with 7 features.
Fitting estimator with 6 features.
Feature ranking by RFF: [ 1  1  1  1  1 59 14 44 79 61 58 67 70 41 77 33 51 24  3 34  9 71 63 91
 73 47 53 26 86 17 13 94 88 31  2 62 19 25 11 48 95 84 56 10 68 18 74 45
 39 15 43 96 32 80 52 36  4 57 82 50 27 78 69 85 93 65 29  7 30 55 46 49
 20 60 72 16 42 92 23 64 81 22 38 90 66 28 35 76 83  8 37 21 54 40 87 75
  5 12  6 89]
RFE selected features AUC: 0.9770972008875235

AUC が理想的な状況よりも落ちているのは、ホールドアウト検証なので使えるデータが減っているためだろうか。

選択する特徴量の数を最適化する

ところで、RFE では選択する特徴量の数をあらかじめ指定する必要がある。 先ほどのサンプルコードでは、あらかじめ有効な特徴量の数が分かっていたので 5 を指定した。 しかしながら、そもそもいくつ取り出すのが良いのかはあらかじめ分かっていない状況の方が多いだろう。

選択する特徴量の数は、一体どうやって決めれば良いのだろうか。 悩んだものの、そもそもハイパーパラメータの一種と捉えて最適化してしまえば良いのではと考えた。 そこで、続いては RFE で選択する特徴量の数を Optuna を使って最適化してみよう。

まずは Optuna をインストールしておく。

$ pip install optuna

以下のサンプルコードでは、AUC が最大になるように取り出す特徴量の数を最適化している。

#!/usr/bin/env python
# -*- coding: utf-8 -*-

from functools import partial

import optuna
from sklearn.datasets import make_classification
from sklearn.ensemble import RandomForestClassifier
from sklearn.feature_selection import RFE
from sklearn.metrics import roc_auc_score
from sklearn.model_selection import train_test_split
from sklearn.model_selection import cross_val_predict
from sklearn.model_selection import StratifiedKFold


def objective(X, y, trial):
    """最適化する目的関数"""
    clf = RandomForestClassifier(n_estimators=100,
                                 random_state=42)

    # RFE で取り出す特徴量の数を最適化する
    n_features_to_select = trial.suggest_int('n_features_to_select', 1, 100),
    rfe = RFE(estimator=clf,
              n_features_to_select=n_features_to_select)

    X_train, X_eval, y_train, y_eval = train_test_split(X, y,
                                                        shuffle=True,
                                                        random_state=42)
    rfe.fit(X_eval, y_eval)

    X_train_selected = X_train[:, rfe.support_]
    skf = StratifiedKFold(n_splits=5,
                          shuffle=True,
                          random_state=42)
    y_pred = cross_val_predict(clf, X_train_selected, y_train,
                               cv=skf,
                               method='predict_proba')

    metric = roc_auc_score(y_train, y_pred[:, 1])
    return metric


def main():
    args = {
        'n_samples': 500,
        'n_features': 100,
        'n_informative': 5,
        'n_redundant': 0,
        'n_repeated': 0,
        'n_classes': 2,
        'random_state': 42,
        'shuffle': False,
    }
    X, y = make_classification(**args)

    # 目的関数にデータを適用する
    f = partial(objective, X, y)

    # Optuna で取り出す特徴量の数を最適化する
    study = optuna.create_study(direction='maximize')

    # 20 回試行する
    study.optimize(f, n_trials=20)

    # 発見したパラメータを出力する
    print('params:', study.best_params)


if __name__ == '__main__':
    main()

実行結果は次の通り。 ちゃんと選択すべき特徴量の数が 5 として最適化できた。

$ python rfeopt.py 
[I 2019-04-20 19:42:22,874] Finished trial#0 resulted in value: 0.9571904165718188. Current best value is 0.9571904165718188 with parameters: {'n_features_to_select': 23}.
[I 2019-04-20 19:42:29,757] Finished trial#1 resulted in value: 0.9299169132711131. Current best value is 0.9571904165718188 with parameters: {'n_features_to_select': 23}.
[I 2019-04-20 19:42:35,810] Finished trial#2 resulted in value: 0.9395487138629638. Current best value is 0.9571904165718188 with parameters: {'n_features_to_select': 23}.
[I 2019-04-20 19:42:45,647] Finished trial#3 resulted in value: 0.8863390621443205. Current best value is 0.9571904165718188 with parameters: {'n_features_to_select': 23}.
[I 2019-04-20 19:42:56,298] Finished trial#4 resulted in value: 0.9714318233553381. Current best value is 0.9714318233553381 with parameters: {'n_features_to_select': 6}.
[I 2019-04-20 19:43:02,694] Finished trial#5 resulted in value: 0.9416543364443433. Current best value is 0.9714318233553381 with parameters: {'n_features_to_select': 6}.
[I 2019-04-20 19:43:04,807] Finished trial#6 resulted in value: 0.9038100386979285. Current best value is 0.9714318233553381 with parameters: {'n_features_to_select': 6}.
[I 2019-04-20 19:43:08,414] Finished trial#7 resulted in value: 0.9231874573184613. Current best value is 0.9714318233553381 with parameters: {'n_features_to_select': 6}.
[I 2019-04-20 19:43:14,815] Finished trial#8 resulted in value: 0.9392783974504895. Current best value is 0.9714318233553381 with parameters: {'n_features_to_select': 6}.
[I 2019-04-20 19:43:19,781] Finished trial#9 resulted in value: 0.9385954928295015. Current best value is 0.9714318233553381 with parameters: {'n_features_to_select': 6}.
[I 2019-04-20 19:43:27,921] Finished trial#10 resulted in value: 0.957503414523105. Current best value is 0.9714318233553381 with parameters: {'n_features_to_select': 6}.
[I 2019-04-20 19:43:37,352] Finished trial#11 resulted in value: 0.7167226269064422. Current best value is 0.9714318233553381 with parameters: {'n_features_to_select': 6}.
[I 2019-04-20 19:43:46,542] Finished trial#12 resulted in value: 0.9767385613475985. Current best value is 0.9767385613475985 with parameters: {'n_features_to_select': 5}.
[I 2019-04-20 19:43:55,495] Finished trial#13 resulted in value: 0.9558815160482587. Current best value is 0.9767385613475985 with parameters: {'n_features_to_select': 5}.
[I 2019-04-20 19:44:03,303] Finished trial#14 resulted in value: 0.9479854313680856. Current best value is 0.9767385613475985 with parameters: {'n_features_to_select': 5}.
[I 2019-04-20 19:44:12,028] Finished trial#15 resulted in value: 0.9614727976325973. Current best value is 0.9767385613475985 with parameters: {'n_features_to_select': 5}.
[I 2019-04-20 19:44:15,797] Finished trial#16 resulted in value: 0.9248235829729115. Current best value is 0.9767385613475985 with parameters: {'n_features_to_select': 5}.
[I 2019-04-20 19:44:16,820] Finished trial#17 resulted in value: 0.9016617345777374. Current best value is 0.9767385613475985 with parameters: {'n_features_to_select': 5}.
[I 2019-04-20 19:44:26,228] Finished trial#18 resulted in value: 0.8863390621443205. Current best value is 0.9767385613475985 with parameters: {'n_features_to_select': 5}.
[I 2019-04-20 19:44:33,167] Finished trial#19 resulted in value: 0.9437030503073071. Current best value is 0.9767385613475985 with parameters: {'n_features_to_select': 5}.
params: {'n_features_to_select': 5}

めでたしめでたし。

Python: IsolationForest で教師なし学習の外れ値検知を試す

今回は教師なし学習で外れ値の検知に使える IsolationForest というアルゴリズムを試してみる。 このアルゴリズムの興味深いところは、教師データの中にある程度外れ値が含まれていても構わないという点。 つまり、アノテーションしていないデータをそのまま突っ込むことが許容されている。

IsolationForest のアルゴリズムでは、決定木を使った分類しやすさにもとづいてデータが正常か外れ値かを判断する。 外れ値は正常なデータに比べると数が少なく、特徴が大きく異なると仮定する。 だとすると、外れ値は正常なデータに比べて分類するのに木の深さがより多く必要と考える。

使った環境は次の通り。

$ sw_vers
ProductName:    Mac OS X
ProductVersion: 10.14.4
BuildVersion:   18E226
$ python -V            
Python 3.7.3

下準備

まずは scikit-learn と matplotlib をインストールしておく。

$ pip install scikit-learn matplotlib

ダミデータを用意する

IsolationForest を試すのに、以下のようなダミーデータを生成した。 特徴量は二次元で、ひとまず Blob でクラスタが 1 つだけある正常値の周囲に一様分布で外れ値を散らしている。

#!/usr/bin/env python
# -*- coding: utf-8 -*-

import numpy as np
from sklearn.datasets import make_blobs
from matplotlib import pyplot as plt


def main():
    # 正常値のデータを作る
    NORMAL_DATA_N = 1000
    args = {
        # 正常値のデータ点数
        'n_samples': NORMAL_DATA_N,
        # 特徴量の次元数
        'n_features': 2,
        # クラスタの数
        'centers': 1,
        # データを生成するための乱数
        'random_state': 42,
    }
    X_normal, y_normal = make_blobs(**args)

    # 外れ値のデータを作る
    OUTLIER_DATA_N = 200
    DISTRIBUTION_RANGE = 6
    X_outlier = np.random.uniform(low=-DISTRIBUTION_RANGE,
                                  high=DISTRIBUTION_RANGE,
                                  size=(OUTLIER_DATA_N, 2))
    y_outlier = np.ones((OUTLIER_DATA_N, ))

    # 正常値を中心に外れ値を分布させる
    X_outlier += X_normal.mean(axis=0)

    # くっつけて一つのデータセットにする
    X = np.concatenate([X_normal, X_outlier], axis=0)
    y = np.concatenate([y_normal, y_outlier], axis=0)

    plt.scatter(X[y == 0, 0],
                X[y == 0, 1],
                label='negative')
    plt.scatter(X[y == 1, 0],
                X[y == 1, 1],
                label='positive')
    plt.legend()
    plt.show()


if __name__ == '__main__':
    main()

上記を実行してみる。

$ python blob.py

すると、以下のような散布図が得られる。

f:id:momijiame:20190420122548p:plain

正常値の領域にも外れ値が含まれてしまっているけど、まあ完全に分離可能なデータなんてそうそうないので。

IsolationForest を適用してみる

それでは、先ほどのデータに IsolationForest を適用してみよう。

以下のサンプルコードでは、ホールドアウト検証でどのように分類されるか可視化すると共に評価指標を計算している。 IsolationForest のインスタンスで fit() メソッドを呼ぶときに目的変数 (y_train) に関する情報を渡していないのがポイント。 また、渡している説明変数 (X_train) の中には約 20% の外れ値が含まれている。

#!/usr/bin/env python
# -*- coding: utf-8 -*-

import numpy as np
from scipy import stats
from sklearn.datasets import make_blobs
from sklearn.ensemble import IsolationForest
from sklearn.model_selection import train_test_split
from sklearn.metrics import precision_score
from sklearn.metrics import recall_score
from sklearn.metrics import f1_score
from sklearn.metrics import matthews_corrcoef
from matplotlib import pyplot as plt


def main():
    # 正常値のデータを作る
    NORMAL_DATA_N = 1000
    args = {
        # 正常値のデータ点数
        'n_samples': NORMAL_DATA_N,
        # 特徴量の次元数
        'n_features': 2,
        # クラスタの数
        'centers': 1,
        # データを生成するための乱数
        'random_state': 42,
    }
    X_normal, y_normal = make_blobs(**args)

    # 外れ値のデータを作る
    OUTLIER_DATA_N = 200
    DIST_RANGE = 6
    X_outlier = np.random.uniform(low=-DIST_RANGE,
                                  high=DIST_RANGE,
                                  size=(OUTLIER_DATA_N, 2))
    y_outlier = np.ones((OUTLIER_DATA_N, ))

    # 正常値を中心に外れ値を分布させる
    X_outlier += X_normal.mean(axis=0)

    # くっつけて一つのデータセットにする
    X = np.concatenate([X_normal, X_outlier], axis=0)
    y = np.concatenate([y_normal, y_outlier], axis=0)

    # ホールドアウト検証するためにデータを分割する
    X_train, X_test, y_train, y_test = train_test_split(X, y,
                                                        test_size=0.3,
                                                        shuffle=True,
                                                        random_state=42,
                                                        stratify=y)

    # IsolationForest
    clf = IsolationForest(n_estimators=100,
                          contamination='auto',
                          behaviour='new',
                          random_state=42)

    # 学習用データを学習させる
    clf.fit(X_train)

    # 検証用データを分類する
    y_pred = clf.predict(X_test)

    # IsolationForest は 正常=1 異常=-1 として結果を返す
    y_pred[y_pred == 1] = 0
    y_pred[y_pred == -1] = 1

    # 評価指標を計算する
    print('precision:', precision_score(y_test, y_pred))
    print('recall:', recall_score(y_test, y_pred))
    print('f1:', f1_score(y_test, y_pred))
    print('mcc:', matthews_corrcoef(y_test, y_pred))

    xx, yy = np.meshgrid(np.linspace(X_normal[:, 0].mean() - DIST_RANGE * 1.2,
                                     X_normal[:, 0].mean() + DIST_RANGE * 1.2,
                                     100),
                         np.linspace(X_normal[:, 1].mean() - DIST_RANGE * 1.2,
                                     X_normal[:, 1].mean() + DIST_RANGE * 1.2,
                                     100))
    Z = clf.decision_function(np.c_[xx.ravel(), yy.ravel()])
    Z = Z.reshape(xx.shape)

    plt.contourf(xx, yy, Z, cmap=plt.cm.Blues_r)
    threshold = stats.scoreatpercentile(y_pred,
                                        100 * (OUTLIER_DATA_N / NORMAL_DATA_N))
    plt.contour(xx, yy, Z, levels=[threshold],
                    linewidths=2, colors='red')

    plt.scatter(X_train[y_train == 0, 0],
                X_train[y_train == 0, 1],
                label='train negative',
                c='b')
    plt.scatter(X_train[y_train == 1, 0],
                X_train[y_train == 1, 1],
                label='train positive',
                c='r')

    plt.scatter(X_test[y_pred == 0, 0],
                X_test[y_pred == 0, 1],
                label='test negative (prediction)',
                c='g')
    plt.scatter(X_test[y_pred == 1, 0],
                X_test[y_pred == 1, 1],
                label='test positive (prediction)',
                c='y')

    plt.legend()
    plt.show()


if __name__ == '__main__':
    main()

上記の実行結果は次の通り。

$ python isoforest.py 
precision: 0.9215686274509803
recall: 0.7833333333333333
f1: 0.8468468468468469
mcc: 0.8229295359450786

同時に、以下のグラフが得られる。 正常値のクラスタの周囲に識別境界ができて、外れ値検出ができていることが分かる。

f:id:momijiame:20190420122902p:plain

正常値のクラスタを増やしてみる

正常値のクラスタが一つのときは、まあなんとなく上手くいきそうなことが分かった。 続いては二つに増やしてみることにしよう。

以下のサンプルコードでは、先ほどの内容を少し修正してダミーデータのクラスタを二つに増やしている。

#!/usr/bin/env python
# -*- coding: utf-8 -*-

import numpy as np
from scipy import stats
from sklearn.datasets import make_blobs
from sklearn.ensemble import IsolationForest
from sklearn.model_selection import train_test_split
from sklearn.metrics import precision_score
from sklearn.metrics import recall_score
from sklearn.metrics import f1_score
from sklearn.metrics import matthews_corrcoef
from matplotlib import pyplot as plt


def main():
    NORMAL_DATA_N = 1000
    args = {
        'n_samples': NORMAL_DATA_N,
        'n_features': 2,
        # クラスタの数を増やしてみる
        'centers': 2,
        'random_state': 42,
    }
    X_normal, _ = make_blobs(**args)
    y_normal = np.zeros((NORMAL_DATA_N, ))

    OUTLIER_DATA_N = 200
    DIST_RANGE = 6
    X_outlier = np.random.uniform(low=-DIST_RANGE,
                                  high=DIST_RANGE,
                                  size=(OUTLIER_DATA_N, 2))
    y_outlier = np.ones((OUTLIER_DATA_N, ))

    X_outlier += X_normal.mean(axis=0)

    X = np.concatenate([X_normal, X_outlier], axis=0)
    y = np.concatenate([y_normal, y_outlier], axis=0)

    X_train, X_test, y_train, y_test = train_test_split(X, y,
                                                        test_size=0.3,
                                                        shuffle=True,
                                                        random_state=42,
                                                        stratify=y)

    clf = IsolationForest(n_estimators=100,
                          contamination='auto',
                          behaviour='new',
                          random_state=42)

    clf.fit(X_train)

    y_pred = clf.predict(X_test)

    y_pred[y_pred == 1] = 0
    y_pred[y_pred == -1] = 1

    print('precision:', precision_score(y_test, y_pred))
    print('recall:', recall_score(y_test, y_pred))
    print('f1:', f1_score(y_test, y_pred))
    print('mcc:', matthews_corrcoef(y_test, y_pred))

    xx, yy = np.meshgrid(np.linspace(X_normal[:, 0].mean() - DIST_RANGE * 1.2,
                                     X_normal[:, 0].mean() + DIST_RANGE * 1.2,
                                     100),
                         np.linspace(X_normal[:, 1].mean() - DIST_RANGE * 1.2,
                                     X_normal[:, 1].mean() + DIST_RANGE * 1.2,
                                     100))
    Z = clf.decision_function(np.c_[xx.ravel(), yy.ravel()])
    Z = Z.reshape(xx.shape)

    plt.contourf(xx, yy, Z, cmap=plt.cm.Blues_r)
    threshold = stats.scoreatpercentile(y_pred,
                                        100 * (OUTLIER_DATA_N / NORMAL_DATA_N))
    plt.contour(xx, yy, Z, levels=[threshold],
                    linewidths=2, colors='red')

    plt.scatter(X_train[y_train == 0, 0],
                X_train[y_train == 0, 1],
                label='train negative',
                c='b')
    plt.scatter(X_train[y_train == 1, 0],
                X_train[y_train == 1, 1],
                label='train positive',
                c='r')

    plt.scatter(X_test[y_pred == 0, 0],
                X_test[y_pred == 0, 1],
                label='test negative (prediction)',
                c='g')
    plt.scatter(X_test[y_pred == 1, 0],
                X_test[y_pred == 1, 1],
                label='test positive (prediction)',
                c='y')

    plt.legend()
    plt.show()


if __name__ == '__main__':
    main()

実行結果は次の通り。

$ python twoclusters.py 
precision: 0.5238095238095238
recall: 0.7333333333333333
f1: 0.611111111111111
mcc: 0.528680532637681

また、以下のグラフが得られる。

f:id:momijiame:20190420123453p:plain

評価指標は悪化しているものの、可視化したものを見るとちゃんと二つのクラスタの周囲に分離境界ができていることがわかる。

いじょう。

Python: scikit-learn の cross_val_predict() 関数で OOF な特徴量を作る

scikit-learn には cross_val_predict() という関数がある。 この関数は、教師データを k-Fold などで分割したときに OOF (Out of Fold) なデータの目的変数を推論する目的で使われることが多い。 なお、OOF (Out of Fold) というのは、k-Fold などでデータを分割した際に学習に使わなかったデータを指している。

scikit-learn.org

ちなみに、この関数は method オプションを指定すると fit() メソッドのあとに呼び出すメソッド名を自由に指定できる。 典型的には、分類問題において predict_proba を指定することで推論結果を確率として取得するために使うことが多い。

ただ、この method オプションには predict 系のメソッドに限らず、別に何を指定しても良いことに気づいた。 そこで、今回の記事では cross_val_predict() 関数を使って OOF な特徴量を作ってみることにした。 というのも、Target Encoding と呼ばれる目的変数を利用した特徴量抽出においては OOF することが Leakage を防ぐ上で必須になる。 もし、その作業を cross_val_predict() 関数と scikit-learn の Transformer を組み合わせることでキレイに書けるとしたら、なかなか便利なのではと思った。

今回使った環境は次の通り。

$ sw_vers
ProductName:    Mac OS X
ProductVersion: 10.14.4
BuildVersion:   18E226
$ python -V    
Python 3.7.3

下準備

まずは pandas と scikit-learn をインストールしておく。

$ pip install pandas scikit-learn

サンプルコード

以下に cross_val_predict() 関数と Transformer を組み合わせて Target Encoding した特徴量を抽出するサンプルコードを示す。 TargetMeanEncodingTransformer という名前で Target Encoding する Transformer クラスを定義している。 これをそのまま使ってしまうと Target Leakage が起こるため cross_val_predict() 関数と組み合わせることで OOF な特徴量を生成している。 ちなみに cross_val_predict() 関数の返り値は numpy の配列になるため、pandas と組み合わせて使うときはその点に考慮が必要になる。

#!/usr/bin/env python
# -*- coding: utf-8 -*-

import pandas as pd
from sklearn.base import BaseEstimator
from sklearn.base import TransformerMixin
from sklearn.model_selection import StratifiedKFold
from sklearn.model_selection import cross_val_predict


class TargetMeanEncodingTransformer(BaseEstimator, TransformerMixin):
    """Target mean encoding に使う scikit-learn の Transformer

    NOTE: Target leakage を防ぐために必ず OOF で特徴量を作ること"""

    def __init__(self, category, target=None):
        """
        :param category: エンコード対象のカラム名
        :param target: 目的変数のカラム名
        """
        self.category_ = category
        self.target_ = target
        # 学習したデータを保存する場所
        self.target_mean_ = None

    def fit(self, X, y=None):
        # エンコード対象の特徴量をカテゴリごとにグループ化する
        gdf = X.groupby(self.category_)
        # ターゲットの比率を計算する
        self.target_mean_ = gdf[self.target_].mean()
        # 自身を返す
        return self

    def transform(self, X, copy=None):
        # エンコード対象のカラムを取り出す
        target_series = X[self.category_]
        # エンコードする
        transformed = target_series.map(self.target_mean_.to_dict())
        # 特徴量を返す
        return transformed

    def get_params(self, deep=True):
        # NOTE: cross_val_predict() は Fold ごとに Estimator を作り直す
        #       そのため get_params() でインスタンスのパラメータを得る必要がある
        return {
            'category': self.category_,
            'target': self.target_,
        }


def main():
    # 元データ
    data = [
        ('Apple', 1),
        ('Apple', 1),
        ('Apple', 0),
        ('Banana', 1),
        ('Banana', 0),
        ('Banana', 0),
        ('Cherry', 0),
        ('Cherry', 0),
        ('Cherry', 0),
    ]
    columns = ['category', 'delicious']
    df = pd.DataFrame(data, columns=columns)

    transformer = TargetMeanEncodingTransformer(category='category',
                                                target='delicious')

    # k-Fold しないで適用した場合 (Target leak するのでやっちゃダメ!)
    encoded_without_kfold = transformer.fit_transform(df)
    encoded_without_kfold.name = 'target_mean_encoded'
    print('Without k-Fold')
    concat_df = pd.concat([df, encoded_without_kfold], axis=1, sort=False)
    print(concat_df)

    # k-Fold して適用した場合 (データ点数の関係で実質 LOO になってるので本来はこれもすべきではない)
    skf = StratifiedKFold(n_splits=3,
                          shuffle=True,
                          random_state=42)
    # NOTE: numpy の array として結果が返る点に注意する
    encoded_with_kfold = cross_val_predict(transformer,
                                           # NOTE: エンコード対象のカテゴリで層化抽出する
                                           df, df.category,
                                           cv=skf,
                                           # fit() した後に transform() を呼ぶ
                                           method='transform')
    print('With k-Fold')
    concat_df = pd.concat([df,
                           pd.Series(encoded_with_kfold,
                                     name='target_mean_encoded')
                           ], axis=1, sort=False)
    print(concat_df)


if __name__ == '__main__':
    main()

上記の実行結果は次の通り。 k-Fold ありのパターンでは、ちゃんと OOF で Target Encoding した特徴量が作れているようだ。

$ python oof.py 
Without k-Fold
  category  delicious  target_mean_encoded
0    Apple          1             0.666667
1    Apple          1             0.666667
2    Apple          0             0.666667
3   Banana          1             0.333333
4   Banana          0             0.333333
5   Banana          0             0.333333
6   Cherry          0             0.000000
7   Cherry          0             0.000000
8   Cherry          0             0.000000
With k-Fold
  category  delicious  target_mean_encoded
0    Apple          1                  0.5
1    Apple          1                  0.5
2    Apple          0                  1.0
3   Banana          1                  0.0
4   Banana          0                  0.5
5   Banana          0                  0.5
6   Cherry          0                  0.0
7   Cherry          0                  0.0
8   Cherry          0                  0.0

いじょう。